Yield on Cost: Measuring for Success
If the first step in sucuessfully managing something is to determine the desired outcome (set a goal), then the logical second step is to determine how to measure your progress to ensure you are moving toward your goal. Most investors look at anualized returns and compare it to a benchmark when evaluating their portfolio. Beyond benchmarking an annualized return, there is a great disparity in how investors measure their progress. One of the more interesting metrics I track is Yield on Cost (YOC). It is simply the annual dividend rate times number of shares owned divided by what you paid for the investment (basis).
Many knowledgeable investors are quick to point out that YOC is an irrelevant metric. They argue that current yield is what is meaningful when comparing investments. They are correct in this statement. YOC is entirely specific to the timing of an investment. You can have a different YOC for the same investment purchased at different times on the same day. It is totally determined by the price paid.
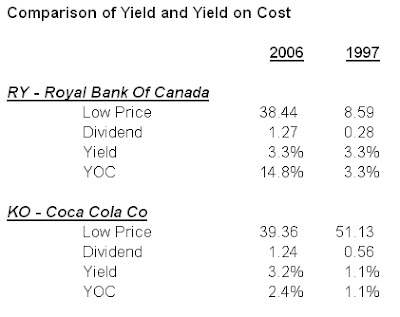
If the objective of an income investor is to invest in securities with increasing income over time, the best metric to measure your success in achieving this objective is Yield on Cost. An illustrative example will help. Consider two companies RY and KO. Let’s assume you purchase both companies at their low in 1997 and hold them through 2006.
If you were judging your investments solely on current yield, they would be virtually the same in 2006 at slightly over 3%. However, based on your original investment, the YOC for RY is more than six times that of KO. This occurred while the average dividend growth rate for RY was only double that of KO – now that is the kind of leverage I like!
As an income investor, I would much rather have held RY during this period.
Dividend growth is the reason you choose an equity investment over over a safer investment such as a high-yield Money Market Fund. I track YOC because I expect it to grow over time. As an example let’s say, the YOC on a dividend portfolio is 4.95% with an average dividend growth rate of 7.5%, these are the YOCs I would expect to see in the coming years (dividends not reinvested):
- Now 4.95%
- 1-yr 5.30%
- 3-yr 6.06%
- 5-yr 6.94%
- 8-yr 8.51%
- 10-yr 9.74%
- 15-yr 13.66%
- 20-yr 19.15%
19% in 20 years – that’s something to get excited about. In reality, I think I can beat that by fine-tuning my portfolio.
What are your thoughts about yield on cost?
Full Disclosure: Long KO.
Related Articles
Tags: RY, KO,
Published at Tue, 25 Jan 2022 00:00:00 -0800
