Stock Market Returns in 2021 – Week in Review
Last Updated on January 2, 2022 by Dividend Power
Stock Market Returns in 2021
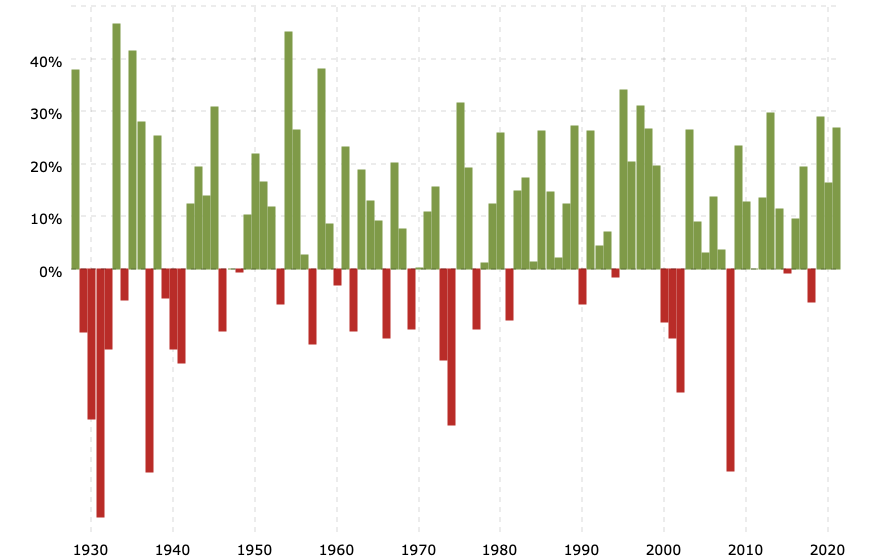
I would like to wish Dividend Power’s readers a Happy New Year! This year was the third year in a row of strong positive stock market returns after a down year in 2018. According to macrotrends, the S&P 500 Index returned (-6.24%) in 2018 followed by 28.88% in 2019, 16.26% in 2020, and 26.89% in 2021. According to Warren Buffett’s 2020 Annual Letter, the S&P 500 Index returned (-4.4%) in 2018, followed by 31.5% in 2019 and 18.4% in 2020. The difference between the two results is how performance is calculated with dividends reinvested. In any case, stock market returns have been good the past decade, in the past three years, and 2021.

Average US Stock Market Returns
According to Goldman Sachs, the US stock market has returned 9.2% on average in the past 140 years. The worst decade was the 1930s, which produced a (-4%) average annual return, while the best decade was the 1950s, which produced a 21% average yearly return. The S&P 5000 Index has returned 13.6% annually over the past ten years. According to Warren Buffett’s annual letter in 2020, the S&P 500 Index has returned 10.2% on average from 1965 to 2020.

Stock Sector Market Returns in 2021
How did the different stock market sectors perform in 2021? In this analysis, we compare the 11 sectors: Basic Materials, Communication Services, Consumer Cyclical, Consumer Defensive, Energy, Financial Services, Healthcare, Industrials, Real Estate, Technology, and Utilities. After a slow start, all 11 sectors were in positive territory for the year. The best performing stock market sector was Energy, up an astounding 56.3%. However, investors must note the Energy sector was the worst-performing sector in 2020. The second best performing stock market sector was Real Estate, up 40.5%, but the sector was down (-4.7%) in 2020. In the chart below from StockRover*, we can see the performance off all 11 sectors.
The worst performing sector was Communication Services at +13.8%. This sector was probably impacted by the underperformance of AT&T (T). AT&T is cutting its dividend and changing strategies causing investors to sell the stock.

Investors should not be surprised why the Energy sector performed well in 2021. We discussed the recovery in oil prices in the 2021 Year in Review. However, to summarize, a drop in demand and oil prices caused a drop in supply in 2020. In 2021, demand accelerated, and supply could not keep up, causing a rise in oil prices. The result was a rise in stock prices as companies in the Energy sector saw higher revenue and profits.
Analyzing the price charts, several sectors struggled at the beginning of the year. But by mid-year, all 11 sectors had positive returns and continued to rise. This trend was briefly interrupted in December, but most sectors finished the year strongly.

Looking ahead in 2022, there are no undervalued sectors. However, if we drill a little deeper and look at a subset of the industry sector ETFs, it is apparent some have underperformed. Investors looking for underperforming stocks may want to look at Biotech, Pharmaceuticals, Internet, Aerospace & Defense, and Health Care Equipment stocks.
For instance, Amgen (AMGN) is a stock in the Biotech Industry and is down (-2.15%) in 2021 (I am long AMGN). Similarly, Merck (MRK) is in the Pharmaceutical Industry and is down (-1.74%) in 2020. Merck is arguably undervalued, trading at a forward price-to-earnings (P/E) ratio of ~13.2X with a dividend yield of 3.6%. In another example, Lockheed Martin (LMT) is flat for the year (I am long LMT). The stock is trading at a P/E ratio of ~13.3X and yielding about 3.2%.

Asset Class Market Returns in 2021
Workers with 401(k) retirement plan portfolios should examine how different asset classes performed in 2020. In addition, it is often a good idea to rebalance to ensure asset allocation targets are met and reduce risk by lowering portfolio volatility.
The simplest way to compare asset classes is to start with the nine Callan asset classes. The nine regular asset classes are Large Cap Equity, Small Cap Equity, Developed ex-US Equity, Emerging Market Equity, US Fixed Income, High Yield, Global ex-US Fixed Income, Real Estate, and Cash.
In this comparison, we use a modified version of the Callan asset classes by dropping ex-US Fixed Income and adding subdividing US Fixed Income. The asset classes we compare are Large Cap Equity, Small Cap Equity, Developed Markets, Emerging Markets, US Short-Term Treasuries, US Medium-Term Treasuries, US Long-Term Treasuries, TIPS, US Investment Grade Corporate Bonds, High Yield Bonds, REITs, Gold, and Cash. Again, Stock Rover* makes comparing asset classes using ETFs as proxies simple.

Unlike 2020, Real Estate performed well and was the best performing asset class in 2021. This sector was followed by the S&P 500 Index and the small-cap stocks. Stocks outside the US did not perform as well as US stocks, and emerging markets performed worse than developed markets.
On the other hand, bonds and cash performed relatively poorly. One exception was Treasury Inflation-Protected Securities (TIPS), which had a good year since inflation is the highest in decades. High-yield bonds also had a positive year.
In addition, gold performed poorly, which is surprising. Gold usually performs well when expectations for inflation are high. However, the US Federal Reserve pivoted and is rapidly tapering and signaled three potential interest rate increases in 2022. Furthermore, cryptocurrencies like Bitcoin are increasingly mainstream and viewed as an alternative to gold. Hence, gold has not performed as well as expected.
Final Thoughts on Stock Market Returns in 2021
The stock market had another good year. For most investors, following a buy-and-hold strategy for US stocks in 2021 and the past several years was a good move. The last time international stocks outperformed US stocks was in 2017. Global stocks perform better than US stocks for stretches, such as after the dot-com boom and before the Great Recession. The last time US Treasuries and cash did well on a relative basis was in 2018. However, yields are rock bottom now, and the US Federal Reserve is tapering and possibly raising rates. This change will negatively affect bond prices if yields rise.
Affiliate
Dividend Power has partnered with Sure Dividend, one of the best newsletters for dividend stock investing. The newsletter comes out monthly and highlights their top 10 picks. A lot of effort goes into analyzing hundreds of stocks, doing much of the work for you. They have over 8,000 subscribers, and it grows every month. So, sign up for the Sure Dividend Newsletter*. You can also use the Sure Dividend coupon code DP41off. The regular price for The Sure Dividend Newsletter* is $159 per year and the reduced price through this offer is $118 per year. There is a 7-day free trial and refund grace period as well. So, there is no risk.
Suppose you are interested in higher-yielding stocks from the Sure Retirement Newsletter*. The same coupon code, DP41off, reduces the price by a little over 25% or $41. The regular price of The Sure Retirement Newsletter* is $159 and the reduced price through this offer is $118 per year.
Suppose you are interested in buying and holding stocks with a rising income from the Sure Passive Income Newsletter*. The same coupon code, DP41off, reduces the price by a little over 25% or $41. The regular price of The Sure Passive Income Newsletter* is $159 and the reduced price through this offer is $118 per year.
Chart or Table of the Week
Today I highlight Merck (MRK). The company is a pharmaceutical giant with global operations. Merck operates in two segments: Pharmaceutical (~90% of total revenue) and Animal Health (~10% of total revenue). Merck’s primary medicines are KETRUDA (cancer immunotherapy), JANUVIA (diabetes), GARDASIL (HPV), PRO QUAD (MMR vaccine), VARIVAX (varicella vaccine), BRIDION (muscle relaxant), and PNEUMOVAX 23 (pneumococcal vaccine). Merck has some recent patent losses, but the pipeline is strong, especially in oncology. The forward dividend yield is 3.6% more than the 5-year average and is covered by a conservative payout ratio of ~47%. The forward P/E ratio is 13.2X below the 10-year average of about 14.1X. The screenshot below is from Stock Rover*.

Dividend Increases and Reinstatements
I have created a searchable list of dividend increases and reinstatements. I update this list weekly. In addition, you can search for your stocks by company name, ticker, and date.
Dividend Cuts and Suspensions List
I updated my dividend cuts and suspensions list at the end of December 2021. As a result, the number of companies on the list has risen to 541. Thus, we are well over 10% of companies that pay dividends, having cut or suspended them since the start of the COVID-19 pandemic.
In December, there were no new additions, indicating that companies are experiencing solid profits and cash flow.
Market Indices
Dow Jones Industrial Averages (DJIA): 36,463 (+1.43%)
NASDAQ: 15,700 (+0.30%)
S&P 500: 4,781 (+1.17%)
Market Valuation
The S&P 500 is trading at a price-to-earnings ratio of 30.0X, and the Schiller P/E Ratio is about 40.0X. These two metrics were down the past three weeks. Note that the long-term means of these two ratios are 15.9X and 16.8X, respectively.
I continue to believe that the market is overvalued at this point. I view anything over 30X as overvalued based on historical data. The S&P 500’s valuation came down as the index companies reported solid earnings for the second consecutive quarter.
S&P 500 PE Ratio History

Shiller PE Ratio History

Stock Market Volatility – CBOE VIX
The CBOE VIX measuring volatility was flat this past week to 17.22. The long-term average is approximately 19 to 20. The CBOE VIX measures the stock market’s expectation of volatility based on S&P 500 index options. It is commonly referred to as the fear index.

Fear & Greed Index
I also track the Fear & Greed Index. The Index is now in Greed at a value of 61. The Index is up 21 points this past week. This Index is a tool to track market sentiment. There are seven indicators in the Index measured on a scale of 0 to 100. The Index is calculated by taking the equally-weighted average of each indicator.
These seven indicators in the Index are Put and Call Options, Junk Bond Demand, Market Momentum, Market Volatility, Stock Price Strength, Stock Price Breadth, and Safe Haven Demand.

Economic News
The National Association of Realtors (NAR) Pending Home Sales Index, which tracks the number of homes under contract, fell 2.2% in November to 122.4, a reversal from October’s 7.5% increase. In addition, home-buying activity continued to show signs of moderation as the year-over-year pending sales figures were down 2.7%. Month over month pending home sales declined in the Midwest (-6.3% to 116.8), followed by the West (-2.2% to 105.5), the South (-0.7% to 148.2), and the Northeast (-0.1% to 99.4).
The US Energy Information Administration reported that US commercial crude oil stockpiles decreased by 3.6M barrels to 420.0M barrels (7% below the five-year average) for the week ending December 24th. Crude oil refinery inputs averaged about 15.7M barrels per day, a decrease of 115K barrels per day compared to last week’s average. In addition, gasoline inventories decreased by 1.5M barrels (6% below the five-year average). Refineries operated at 89.7% of their capacity, as gasoline production increased an average of 10.1M barrels per day.
The Labor Department reported a decrease in initial jobless claims for the week ending December 25th. The seasonally adjusted initial claims came in at 198,000, a decrease of 8,000 from the previous week’s upwardly revised level. In addition, the four-week moving average was 199,250, a decrease of 7,250 from last week’s revised average; this is the lowest average since October 1969.
Thanks for reading Stock Market Returns in 2021 – Week in Review!
Here are my recommendations:
If you are unsure how to invest in dividend stocks or are just getting started with dividend investing. Please take a look at my Review of the Simply Investing Report. I also provide a review of the Simply Investing Course. Note that I am an affiliate of Simply Investing.
If you are interested in an excellent resource for DIY dividend growth investors. I suggest reading my Review of The Sure Dividend Newsletter. Note that I am an affiliate of Sure Dividend.
If you want a leading investment research and portfolio management platform with all the fundamental metrics, screens, and analysis tools you need. Read my Review of Stock Rover. Note that I am an affiliate of Stock Rover.
If you would like notifications about when my new articles are published, please sign up for my free weekly e-mail. You will receive a free spreadsheet of the Dividend Kings! You will also join thousands of other readers each month!
*This post contains affiliate links meaning that I earn a commission for any purchases that you make at the Affiliates website through these links. This will not incur additional costs for you. Please read my disclosure for more information.
Published at Sun, 02 Jan 2022 04:00:00 -0800
