cnythzl/iStock via Getty Images
The main adaptation that deranged Federal Reserve policy required of our own discipline in this cycle was to abandon our pre-emptive bearish response to historically-reliable ‘limits’ to speculation, and to instead prioritize the condition of market internals (which have been part of our discipline since 1988). Essentially, we became content to gauge the presence or absence of speculation or risk-aversion, without assuming that there remains any well-defined limit to either. A more recent – though minor – adaptation has been to adopt a slightly more ‘permissive’ threshold in our gauge of market internals when interest rates are near zero and certain measures of risk-aversion are well-behaved. The main effect is to promote a more constructive shift following material market losses.
The question isn’t whether one should adapt to unprecedented Fed policies, but instead, the form those adaptations should take. We are fully convinced that these historic valuation extremes have removed decades of investment returns from the future, and strongly suspect that the Fed has amplified future downside risk as well. I believe investors have placed themselves in a position that is likely to be rewarded by a very long, interesting trip to nowhere over the coming 10-20 years. At worst, they may discover the hard way that a retreat merely to historically run-of-the-mill valuations really does imply a two-thirds loss in the S&P 500. Still, our research efforts in recent years have focused on adaptations that can allow us to better tolerate and even thrive in a world where valuations might never again retreat to their historical norms. We don’t actually expect that sort of world, but have allowed for it.
– John P. Hussman, Ph.D., Maladaptive Beliefs, September 2021
In an economy where the Fed has lost every systematic tether to common sense, empirical evidence, and concern for financial stability, it’s worth beginning this first market comment of 2022 by recalling the ways we’ve adapted in order to navigate that environment. In a world where securities are regularly described on CNBC as “plays,” it’s clear that the financial markets presently have little to do with “investment” – at least not by Benjamin Graham’s definition as “an operation that, upon thorough analysis, promises safety of principal and an adequate return.”
It may be true that zero interest rates provide investors “no alternative” but to speculate. But as Graham emphasized, there are many ways in which speculation can be unintelligent. The first of these is speculating when you think you are investing.
I cringe when I hear analysts talking as if any dividend yield above zero is “better” than zero interest rates. That argument relies entirely on ruling out even the smallest decline in price, and the smallest retreat from current valuation extremes. The dividend yield of the S&P 500 is just 1.3% here. It was lower only in the quarters surrounding the 2000 bubble peak. The run-of-the-mill historical norm is about 3.7%.
Those of you who are familiar with finance can prove to yourself that the effective “duration” of stocks (the weighted-average number of years needed for present value to be repaid by cash flows, and the sensitivity of the market price to changes in the discount rate) works out mathematically to be approximately the price/dividend multiple. From that perspective, one can think of the S&P 500 as being a 77-year duration investment here, compared with a historical norm closer to 27 years.
Depending on market conditions, stocks can have “investment merit,” “speculative merit,” both, or neither. In our own discipline, we gauge “investment merit” by valuation – the relationship between the price of a security and the long-term stream of expected cash flows that we expect that security to deliver over time. We gauge “speculative merit” based on the uniformity or divergence of market internals. When investors are inclined to speculate, they tend to be indiscriminate about it. Since 1998, our most reliable gauge of speculation versus risk-aversion has been based on the signal we extract from the market action of thousands of individual securities, industries, sectors, and security types, including debt securities of varying creditworthiness.
The single difference between the most recent market cycle and other cycles across history is that in every other cycle, speculation always had a well-defined limit. We gauged those extremes based on what I describe as “overvalued, overbought, overbullish” syndromes. Unfortunately, zero interest rates have proved to be a kind of acid that burns through every shred of intellect, driving investors to imagine that any asset that varies in price – regardless of how extreme its valuation or how uncertain its underlying cash flows – is better than zero-interest cash. My error in this cycle was to believe that speculation still had well-defined limits. In late-2017, I abandoned that view and became content to gauge speculation versus risk-aversion based on the condition of market internals. Since then, we’ve refrained from adopting or amplifying a bearish outlook when our measures of internals are constructive, regardless of how extreme valuations might be.
The difference between genius and stupidity is that genius has its limits.
– Albert Einstein
As I observed in September, our more recent adaptations basically amount to criteria for accepting moderate amounts of market exposure – coupled with position limits or safety nets that constrain risk – even in conditions where valuations imply poor long-term returns. These criteria fall into what Ben Graham would describe as “intelligent speculation” – kept within minor limits.
Over four decades of work in the financial markets, I’ve regularly been defensive at bull market peaks, shifting to a constructive, unhedged, or leveraged outlook after valuations plunged toward their historical norms, as they did in the 2000-2002 and 2007-2009 collapses. That flexibility produced beautiful results in previous, complete market cycles. Yet, I’ve never seen such conviction among speculators that the good times will never end, or such faith that the Federal Reserve can make it so. I’m quite certain that this is a delusion, but I am less certain about how long that delusion can persist.
Until the catastrophic consequences of Fed-induced speculation become unavoidable, the reality is that all we can do is deal with it. For us, our preferred ground is to act on what we view as investment merit when it is available. When it isn’t, the acceptable ground is to be content – within minor limits, but as often as possible – to accept periods of favorable market internals as opportunities for what Graham described as “intelligent speculation.” The opening quotes details what I view as our best approach to that problem.
We’re certainly not inclined to accept risk regardless of market conditions, but as I noted in September, we’ve also got sufficiently reliable tools, investment criteria, and just as importantly – position limits and safety nets – to accept moderate amounts of market exposure with greater frequency, even in conditions where valuations imply poor long-term returns. The main consideration there is whether our measures of market internals are constructive, suggesting that investors are inclined toward speculation rather than risk-aversion.
Even with the minor adaptations, I described in September, our measures of market internals remain unfavorable here. Still, even if valuations remain dramatically above their historical norms, I expect that we’ll see periodic but adequate opportunities to accept market exposure even in the coming quarters, within limits that Graham would endorse.
Return-free risk
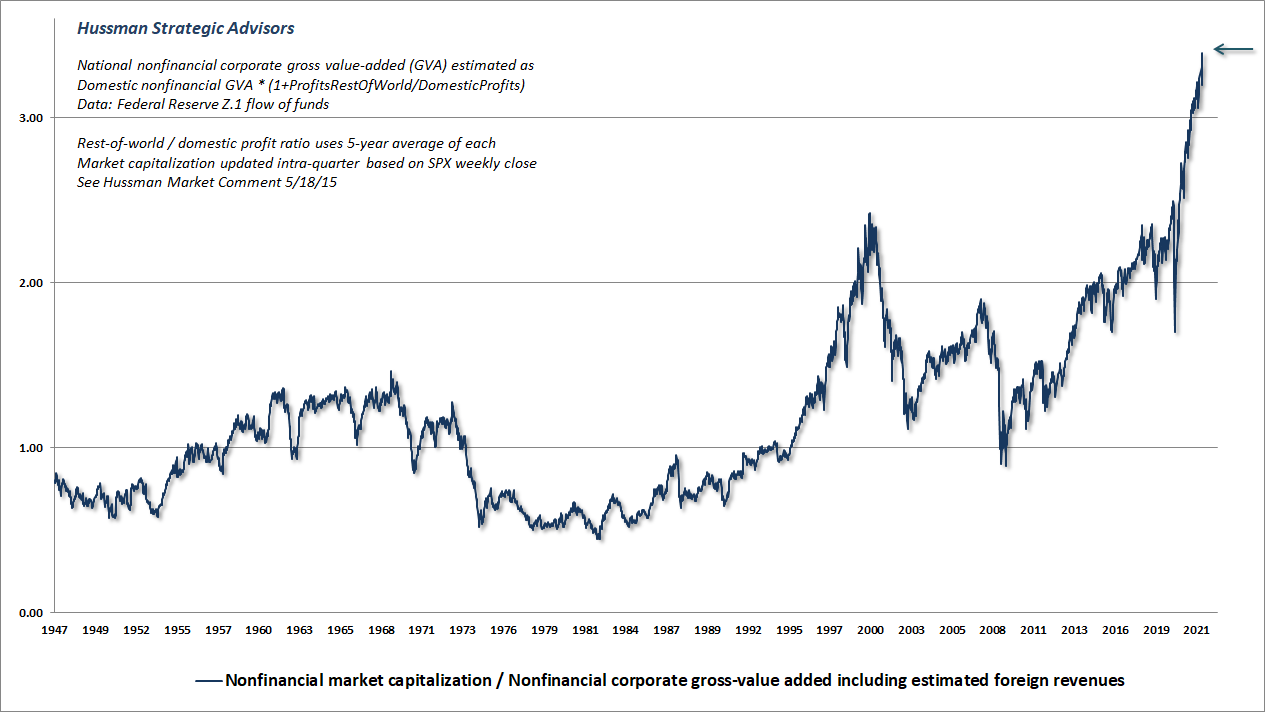
The chart below presents our most reliable valuation measure (based on correlation with actual subsequent market returns), the market capitalization of non-financial U.S. companies as a ratio to their gross-value added, including estimated foreign revenues.
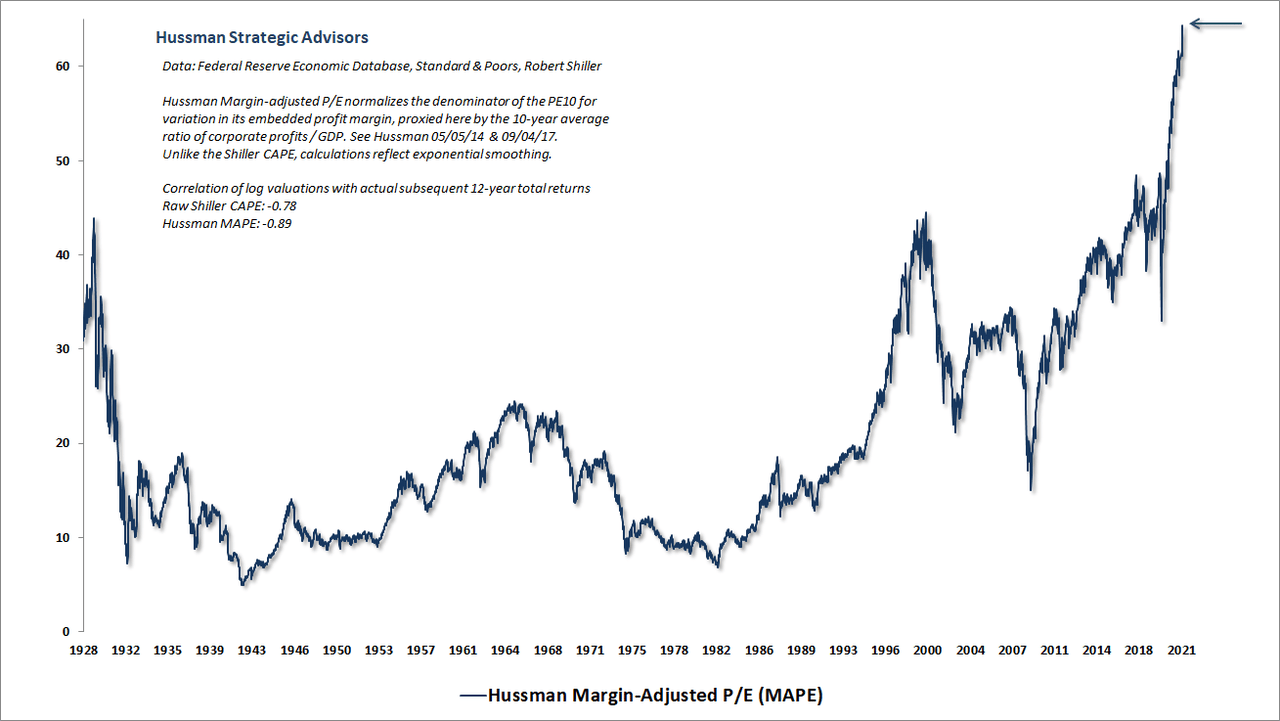
As an alternative measure, the chart below shows our margin-adjusted P/E (MAPE), which has reached extremes easily beyond the 1929 and 2000 bubble peaks. Recall that the S&P 500 lagged Treasury bills from 1929-1947, 1966-1985, and 2000-2013. 50 years out of an 84-year period. When the investment horizon begins at extreme valuations and doesn’t end at the same extremes, the retreat in valuations acts as a headwind that consumes the return that would otherwise be provided by dividends and growth in fundamentals. Do investors really imagine that the outcome from present extremes will be so different? Worse, do they imagine that loading up on speculative market risk will be rewarded with a “risk premium” regardless of the level of valuation?
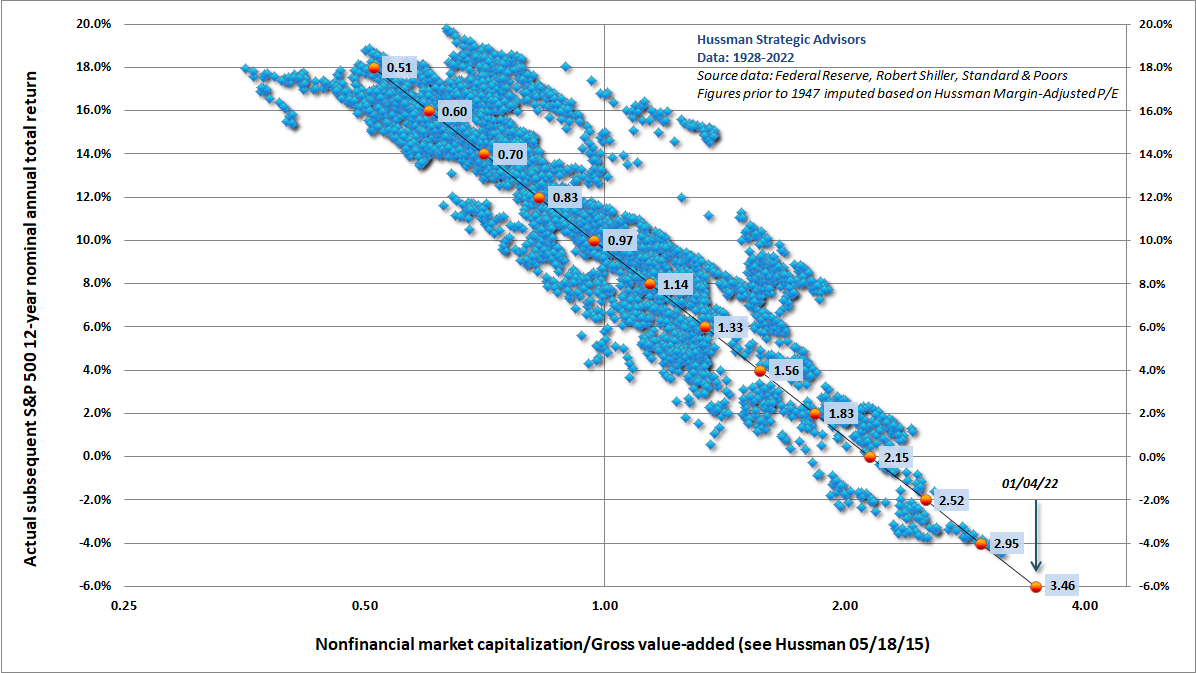
The scatterplot below shows how these valuation measures are related to actual subsequent 12-year S&P 500 nominal total returns, in data since 1928.
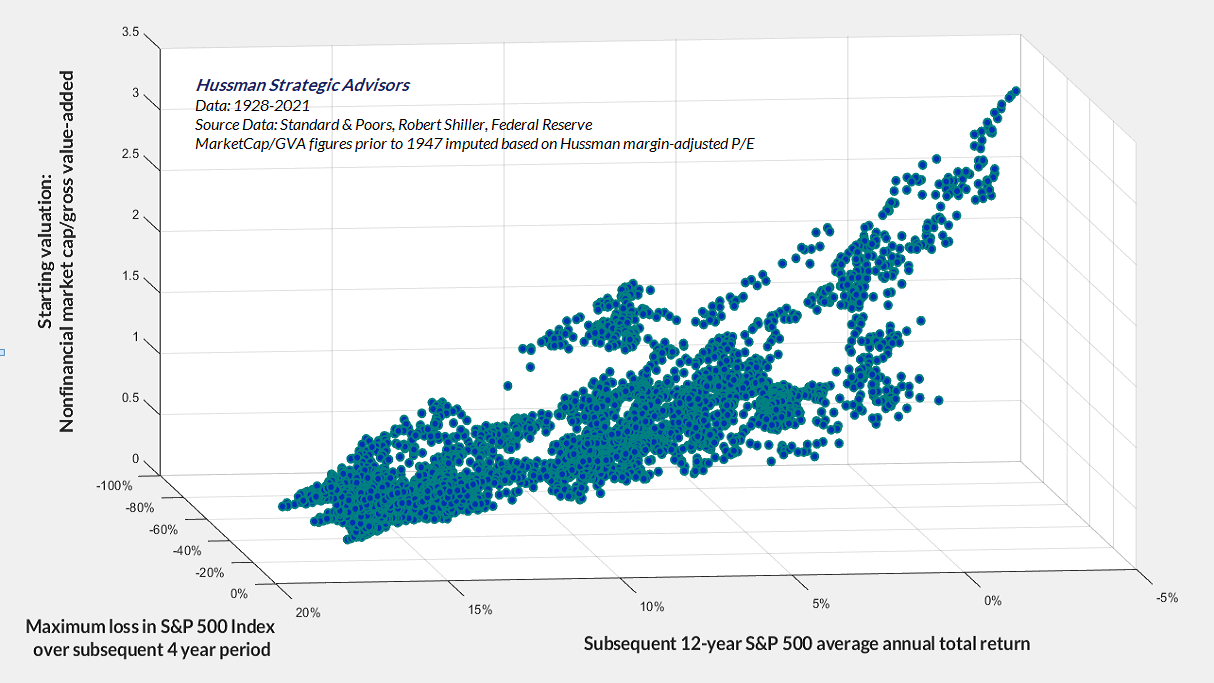
Investors are familiar with the idea of a “tradeoff” between return and risk, which is typically stated as a proposition that investors must accept higher risk if they seek higher expected returns. What investors are typically not taught is that this proposition applies only to “efficient” risks. For example, if a portfolio is poorly diversified, one can typically find another portfolio that can target a higher level of expected return for the same amount of risk, or a lower level of risk for the same expected return. Likewise, in a wildly overvalued market, investors should expect not only poor returns but also higher prospective risk. Put simply, investors are not somehow rewarded for accepting higher levels of what Ben Graham described as “unintelligent” risk.
The chart below may be a rather painful illustration of this principle, particularly for investors who have loaded up on equities at record valuations, in the misguided belief that their expected returns will be enhanced by doing so. The chart reflects data from 1928 to the present. The vertical axis shows our measure of MarketCap/GVA – the ratio of nonfinancial market capitalization to gross value-added, including estimated foreign revenues, which currently stands at a level of about 3.4. The axis at the base show subsequent investment outcomes. One axis shows the average annual total return of the S&P 500 over the subsequent 12-year period. The other axis measures the deepest drawdown loss experienced by the S&P 500 over the following 4-year period (the worst, of course, was the 89% market loss during the Great Depression).
Notice that from a valuation standpoint, there is no “tradeoff” between return and risk. Rather, depressed valuations tend to be followed by both strong long-term returns and modest subsequent losses, while extreme valuations tend to be followed by both poor long-term returns and deep subsequent losses.
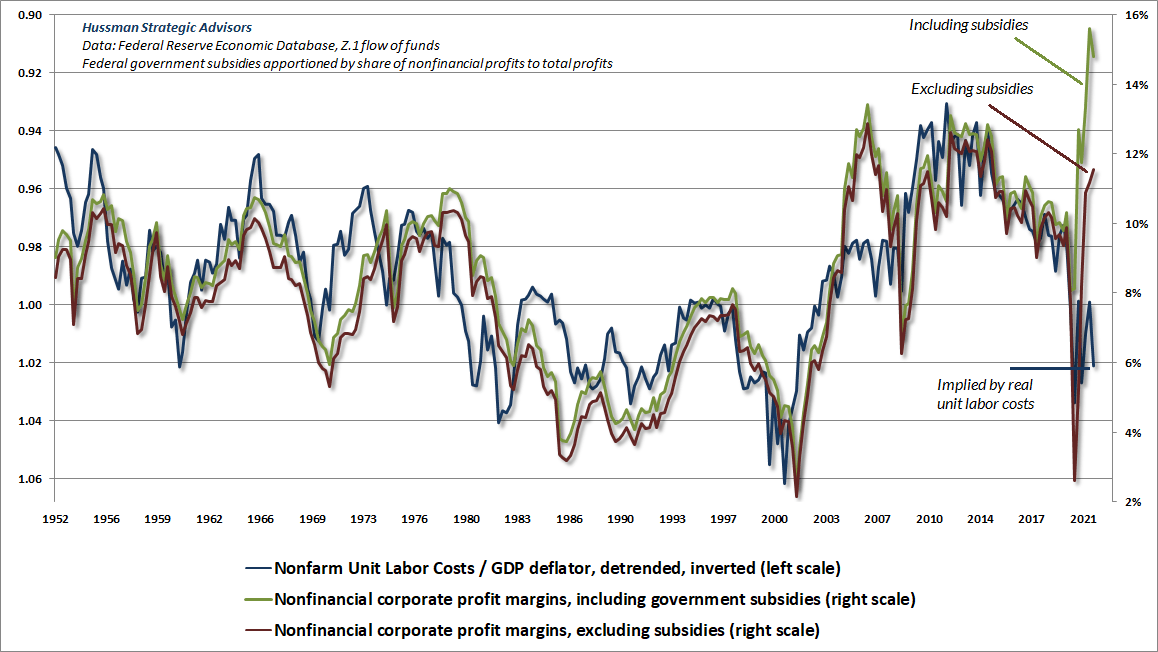
One might argue that – despite being better correlated with subsequent market returns than alterative metrics – the ratio of market capitalization to gross value-added (essentially corporate revenues) is an inappropriate measure of stock market valuations, because profit margins are currently so high. The problem here is that profit margins are high largely because of pandemic-related subsidies, and because real wage growth was so dismal coming out of the global financial crisis (another cost of Fed-induced yield-seeking speculation). The chart below offers some useful perspective on where corporate profit margins are at present, how much of that impact is attributable to fiscal support (primarily in the form of PPP provided to employers who used it to offset compensation expenses), and where profit margins may eventually settle if they again become aligned with real unit labor costs.
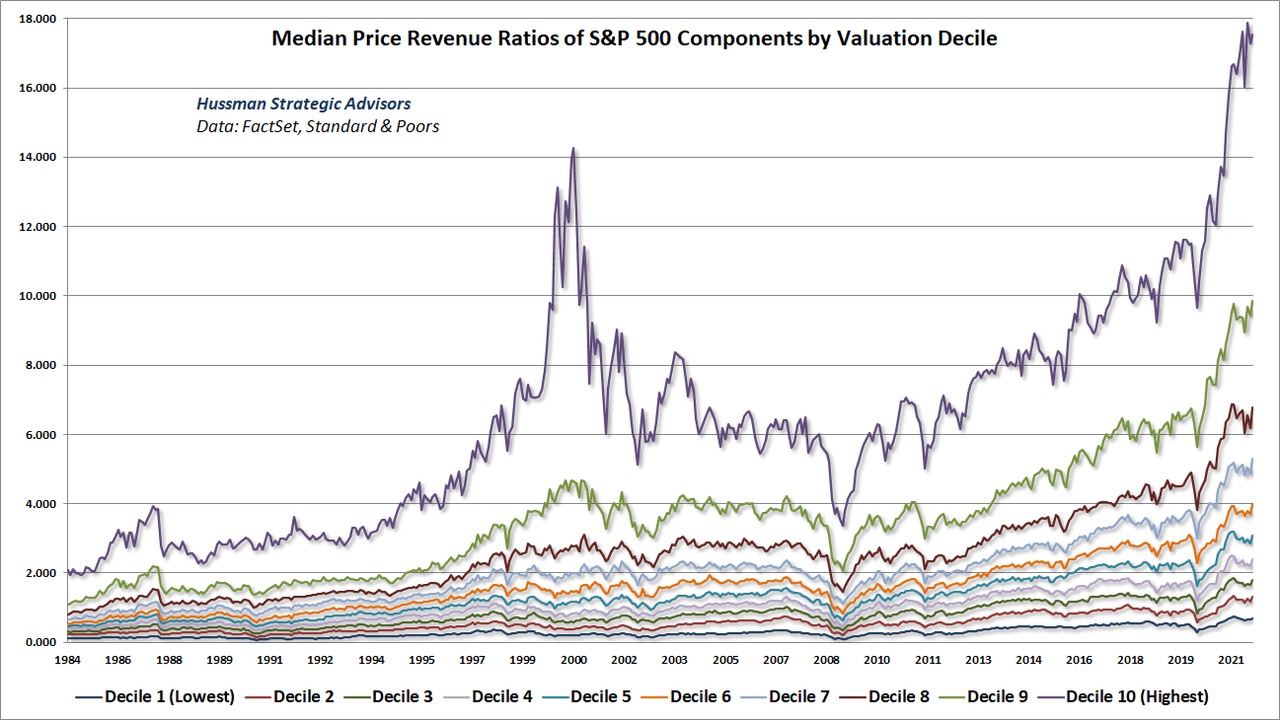
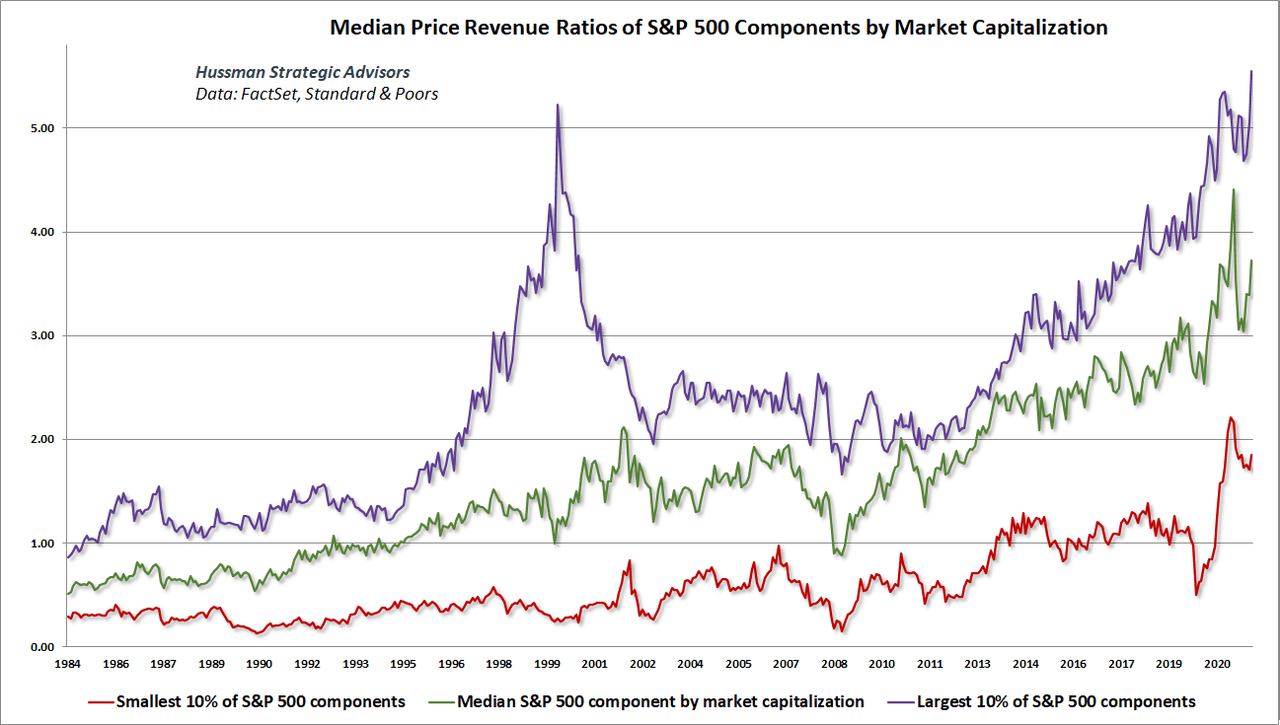
One might also argue that the elevated valuation of the equity market here is driven by a small subset of glamour technology stocks. That’s an argument we hear quite a bit, but the problem is that it’s utterly incorrect. Even excluding the most overvalued stocks or the largest capitalization stocks, the broad market is at record extremes here.
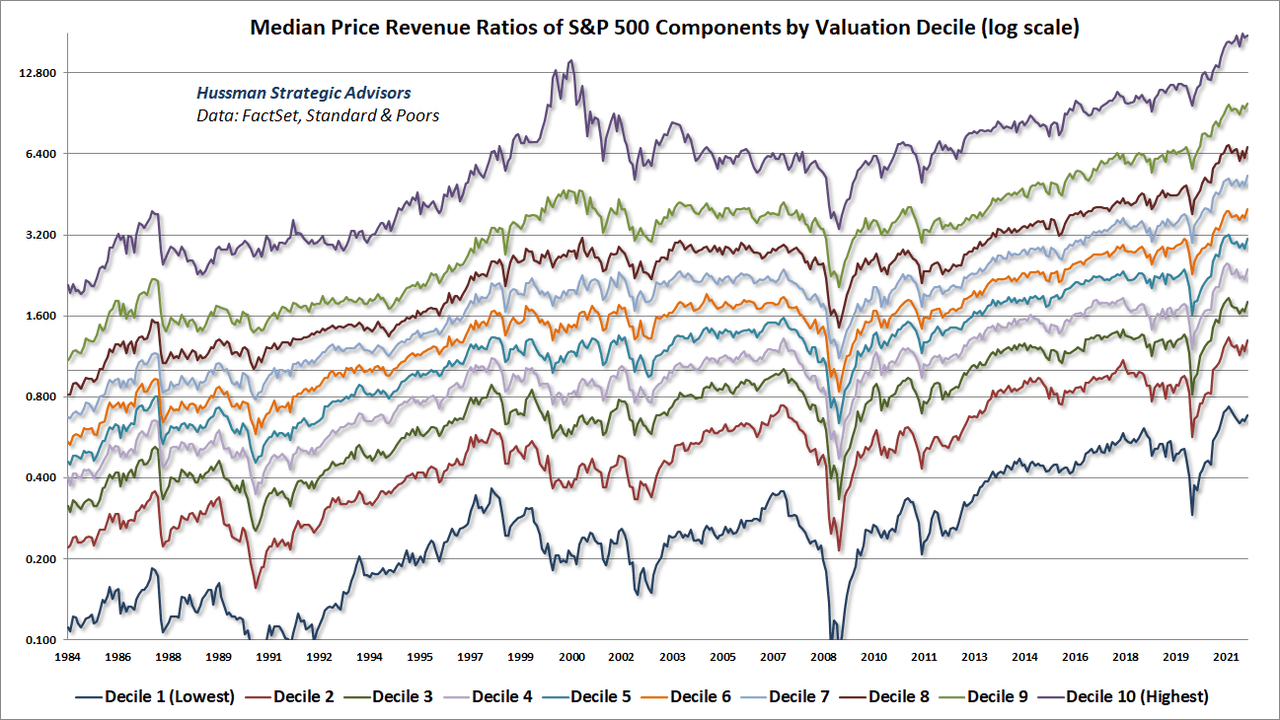
The chart below divides S&P 500 components into ten deciles ranked by price/revenue ratio and shows the median price/revenue ratio within each decile. At present, every one of these deciles is at or near record highs. Notably, high price/revenue groups typically reflect technology, communications, and medical stocks, while low price/revenue groups typically reflect industries like banking and retail. As a result, each line should be compared with its own history – the main question being how many of them are extremely elevated or depressed.
The chart below is the same as the preceding chart, but on log scale, which allows easier comparison of each decile with its own history.
The chart below illustrates the extreme valuation of S&P 500 components, but in this case, each decile is formed based on market capitalization. Note that while the largest capitalization stocks in the S&P 500 currently sport more extreme price/revenue ratios than at the 2000 bubble peak, so too do the S&P 500 components with the smallest market capitalizations.
A Fed-induced speculative bubble
The chart below shows how deranged Federal Reserve policy has become. I use that word advisedly: de-ranged as in wildly outside of historical bounds and also deranged as in intellectually unsound. The most important issue facing the Fed here isn’t how quickly to taper its asset purchases, or when the next rate hike should occur. The real problem for the Fed is that it has completely abandoned any semblance to a systematic policy framework, in apparent preference for a purely discretionary one.
Systematic policy means that your policy variables are correlated with, and informed by, current, lagged, and projected data on output, employment, and inflation. There are numerous systematic policy benchmarks, or a basket of them, that could be used – even as very loose guidelines – to tether Fed policy decisions to observable data. It’s easy to estimate whether deviations from systematic policy benchmarks have a large effect on subsequent economic activity (the answer is that they do not). Instead, the modern Federal Reserve has committed itself to operating monetary policy entirely by the seat of its pants.
A systematic policy would allow individuals and financial markets to anticipate the general stance of monetary policy based on observable data. Instead, the Federal Reserve has fashioned itself into a reckless circus clown handing out lollipops to diabetic toddlers. Having taught them that they will be continually appeased, regardless of the long-term consequences, even a “taper” is now met with wails of surprise, crisis, and tantrum.
The Federal Funds rate remains pegged at zero, with the monetary base at nearly 28% of GDP. This, despite 7% CPI inflation, 3.9% unemployment, real output just 1.6% shy of the CBO estimate for potential GDP, and yield-seeking financial speculation that has driven the equity market to the highest valuations and lowest yields of any point in U.S. history outside of the 2000 market peak.
The most important issue facing the Fed here isn’t how quickly to taper its asset purchases, or when the next rate hike should occur. The real problem for the Fed is that it has completely abandoned any semblance to a systematic policy framework, in apparent preference for a purely discretionary one.
The current level of the monetary base relative to GDP is utterly at odds with Section 2A of the Federal Reserve Act, which instructs the Fed to “maintain long-run growth of the monetary and credit aggregates commensurate with the economy’s long-run potential to increase production.” The ratio of base money to GDP never exceeded 16% before 2008. The nearest alternative to holding zero-interest base money is to hold a Treasury bill, and 16% of GDP in zero-interest base money is already sufficient to drive T-bill rates to zero. Until the Federal Reserve contracts its balance sheet by half, the only way the Fed can raise short-term interest rates above zero is by explicitly paying interest to banks on their excess reserves (IOER).
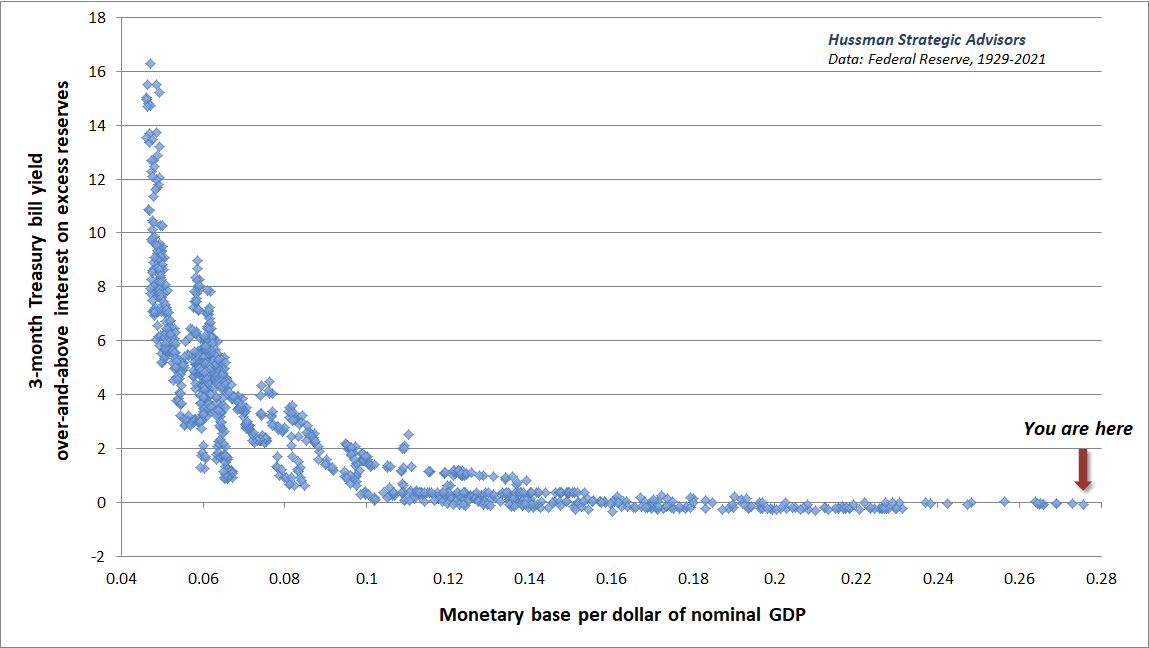
Keep in mind that this zero-interest money created by the Fed can change hands, and can be intermediated from one holder to another, but it doesn’t disappear by “going” anywhere or finding another “home.” It just changes hands. It’s a pile of hot potatoes that will, and must, stay in the form of zero-interest cash until the Fed mops it up. That’s how the Fed has become responsible for the most pervasive speculative bubble, the most extreme level of valuation, and the greatest level of financial instability in history. The only question is how long they can keep it up, by repeatedly stomping on the accelerator and making the ultimate consequences worse.
Systematic policy means that your policy variables are correlated with, and informed by, current, lagged, and projected data on output, employment, and inflation. There are numerous systematic policy benchmarks, or a basket of them, that could be used – even as very loose guidelines – to tether Fed policy decisions to observable data. Instead, the modern Federal Reserve has committed itself to operating monetary policy entirely by the seat of its pants.
Remember also that the elevated market capitalization of stocks is not aggregate “wealth.” Every security must be held by someone until it is retired. If one investor sells at an elevated price, another investor has also bought the security at that price. In aggregate, the only thing the holder, or series of holders, will get from the security is the long-term stream of cash flows that it delivers over time. The wealth is in the cash flows. An elevated market capitalization only allows current holders to receive a transfer of savings from some other investor, who then holds the bag. No wonder that stock sales by corporate insiders have reached record extremes. So not only has the Fed enabled a speculative bubble, it has also widened the wealth gap by enabling a massive transfer of aggregate savings to the top 1%.
Put simply, by relentlessly depriving investors of risk-free return, the Federal Reserve has spawned an all-asset speculative bubble that we estimate will provide investors little but return-free risk. The chart below shows the menu of estimated 10-year returns across various conventional asset classes. Each line shows a different point in time, including the 1982 and 2009 market lows, and the 2000, 2007, and 2020 market highs. The current menu of estimated prospective investment returns is the worst in history.
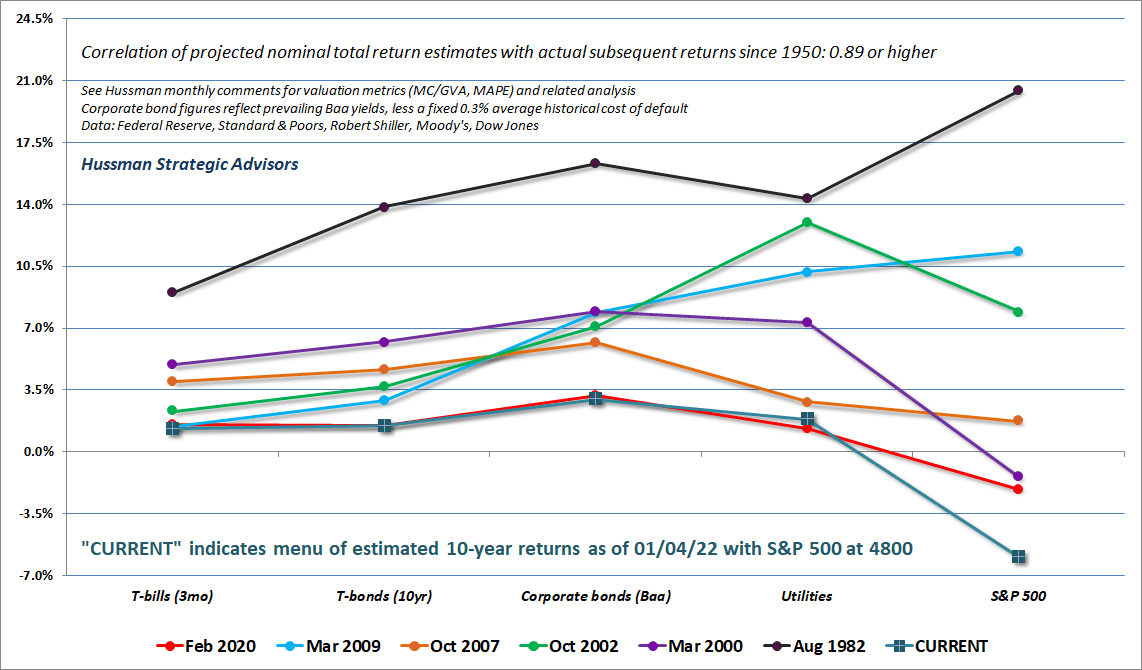
Meanwhile, remember that easy money does not prevent periodic market losses when market internals are unfavorable. The reason is simple. When investors become risk-averse, safe, low-interest liquidity becomes a desirable asset rather than an inferior one. So creating more of the stuff doesn’t support stocks. In contrast, when investors are inclined to speculate, they psychologically rule out the possibility of capital losses. In that environment, zero-interest liquidity burns a hole in both their pockets and their souls. They feel the need to get rid of it, so they chase risky securities regardless of their valuations. Unfortunately, every dollar that a buyer brings “into” the stock market in the hands of a buyer goes “out of” the stock market in the hands of a seller.
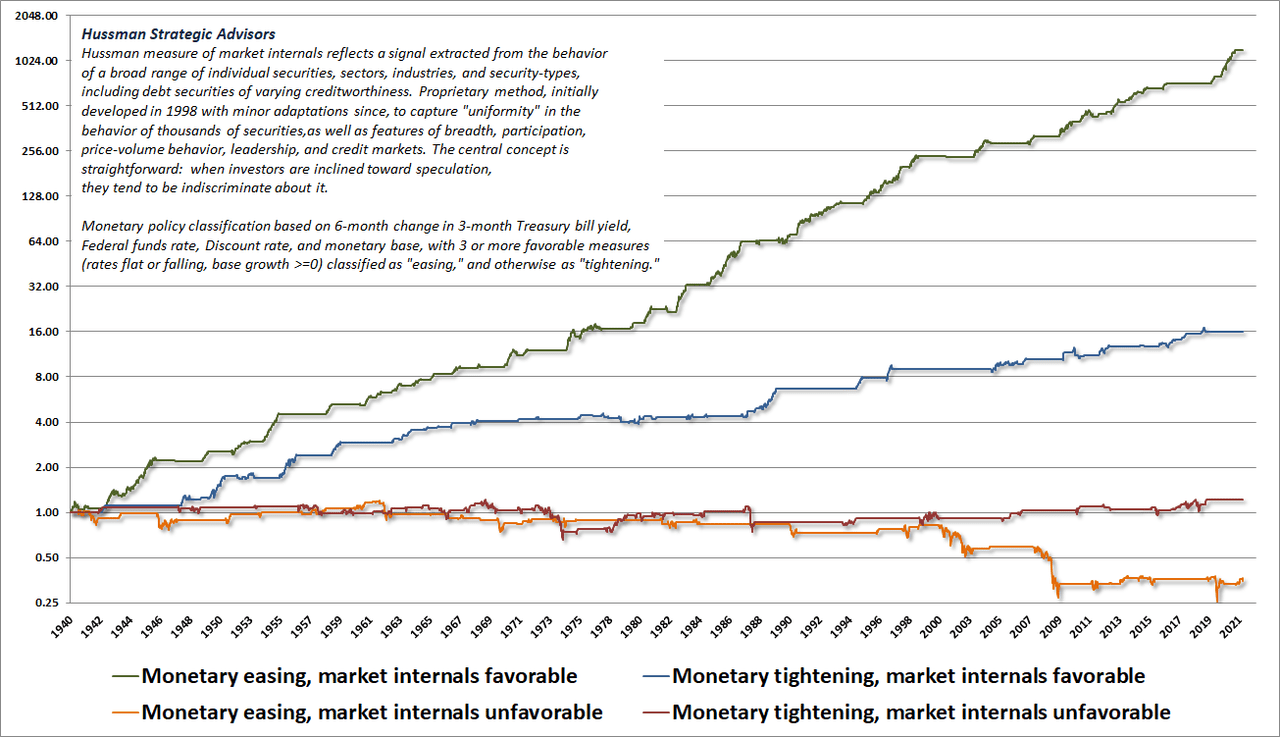
The chart below presents the cumulative total return of the S&P 500, classified into four groups based on the condition of market internals and the stance of monetary policy. The chart is historical, does not represent any investment portfolio, does not reflect valuations or other features of our investment approach, and is not an assurance of future outcomes. It’s worth noting that when investors are inclined to speculate (as gauged by favorable market internals), Fed easing can substantially amplify that speculation. But it’s also worth noting that when investors are inclined toward risk-aversion, as they were in 2000-2002 and 2007-2009, even persistent and aggressive Fed easing may not support stocks.
The deranged conduct of monetary policy in recent years has certainly forced us to adapt (see the opening quote of this comment). Our main adaptation in recent years has been to abandon the idea that Fed-induced speculation has a “limit” and instead to be content to align our outlook with the prevailing condition of observable market conditions, particularly valuations and our gauge of internals.
The thing that ‘holds the stock market up’ isn’t zero-interest liquidity, at least not in any mechanical way. It’s a particularly warped form of speculative psychology that rules out the possibility of loss, regardless of how extreme valuations have become.
– John P. Hussman, Ph.D., Maladaptive Beliefs, September 12, 2021
Taken together, we enter 2022 amid the most extreme financial bubble in U.S. history, driven by yield-seeking speculation, amplified by a Federal Reserve that has abandoned any tether to systematic monetary policy. Across history, with few exceptions – and none that worked out well – policy tools like the Fed Funds rate and the ratio of base money to GDP have typically had a reasonably strong correlation with observable economic data – unemployment, inflation, and the GDP output gap. The “policy error” of the Fed is already behind us and can be measured by the gap between what the Fed has actually done, and what any reasonable basket of systematic policy guidelines would have suggested instead.
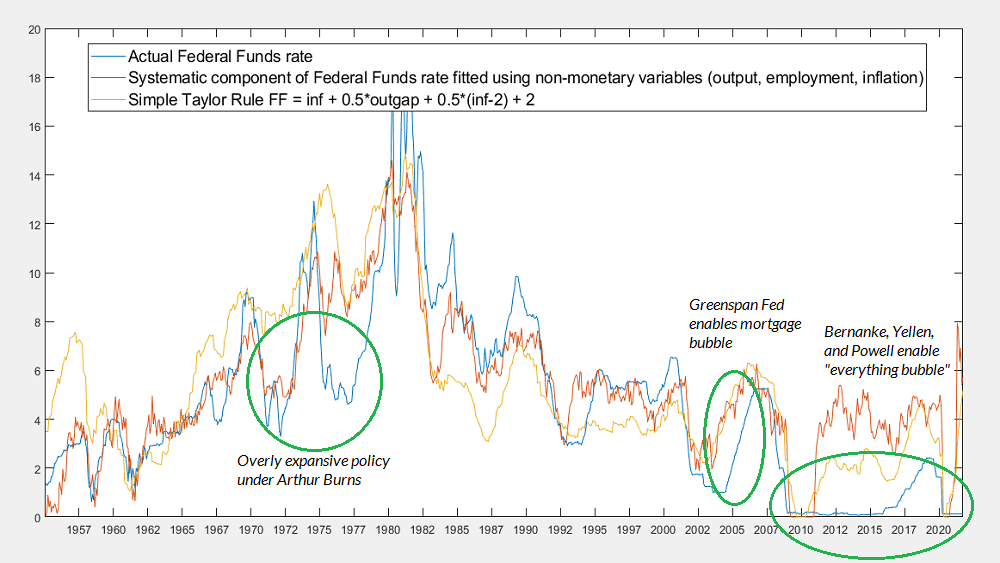 Data: Federal Reserve
If there was a strong relationship of reasonable effect-size between the Fed’s activist policy departures and subsequent outcomes like GDP growth and employment gains, those departures might be worth the financial distortions. Unfortunately, the “activist” component of monetary policy – the difference between actual Fed policy tools and the level implied by systematic policy guidelines – has nearly zero correlation with subsequent GDP growth or employment. As a strategy to juice the economy, activist monetary policy is almost pure noise, but has profound consequences for longer-term outcomes by enabling speculation, malinvestment, financial bubbles, and ultimately financial crises. In my view, the main consequence has been to create a speculative financial bubble that now offers investors little but return-free risk, and it will end badly. For more on systematic monetary policy guidelines like the Taylor Rule, see Bill Hester’s recent research article – Collision Course: Monetary Tightening Meets and Easy-Money Bubble.
Having correctly projected the extent of prospective market losses at the 2000 and 2007 extremes (including a March 2000 projection of an 83% loss in technology stocks), we can project that the S&P 500 would have to lose about 70% of its value here – simply to touch the run-of-the-mill valuation norms that have historically been associated with expected long-term nominal returns of about 10% annually.
Still, nothing in our discipline relies on valuations ever visiting those historical norms again. Instead, we are prepared for anything and are content to align our investment stance with observable market conditions – primarily measures of valuation (to gauge investment merit) and market internals (to gauge speculative pressure).
Disclosure notice
Performance data quoted represents past performance. Past performance does not guarantee future results. Investment return and principal value of an investment will fluctuate so that an investor’s shares, when redeemed, may be worth more or less than their original cost. Current performance may be lower or higher than performance data quoted. More current performance data through the most recent month-end are available at the Fund’s website www.hussmanfunds.com or by calling 1-800-487-7626.
Investors should consider the investment objectives, risks, and charges and expenses of the Funds carefully before investing. For this and other information, please obtain a Prospectus and read it carefully.
The Hussman Funds have the ability to vary their exposure to market fluctuations depending on overall market conditions, and they may not track movements in the overall stock and bond markets, particularly over the short-term. While the intent of this strategy is long-term capital appreciation, total return, and protection of capital, the investment return and principal value of each Fund may fluctuate or deviate from overall market returns to a greater degree than other funds that do not employ these strategies. For example, if a Fund has taken a defensive posture and the market advances, the return to investors will be lower than if the portfolio had not been defensive. Alternatively, if a Fund has taken an aggressive posture, a market decline will magnify the Fund’s investment losses. The Distributor of the Hussman Funds is Ultimus Fund Distributors, LLC., 225 Pictoria Drive, Suite 450, Cincinnati, OH, 45246.
The Hussman Strategic Growth Fund has the ability to hedge market risk by selling short major market indices in an amount up to, but not exceeding, the value of its stock holdings. However, the Fund may experience a loss even when the entire value of its stock portfolio is hedged if the returns of the stocks held by the Fund do not exceed the returns of the securities and financial instruments used to hedge, or if the exercise prices of the Fund’s call and put options differ, so that the combined loss on these options during a market advance exceeds the gain on the underlying index. The Fund also has the ability to leverage the amount of stock it controls to as much as 1 1/2 times the value of net assets, by investing a limited percentage of assets in call options.
The Hussman Strategic Allocation Fund invests primarily in common stocks, bonds, and cash equivalents (such as U.S. Treasury bills and shares of money market mutual funds, aligning its allocations to these asset classes based on prevailing valuations and estimated expected returns in these markets. The investment strategy adds emphasis on risk-management to adjust the Fund’s exposure in market conditions that suggest risk-aversion or speculation among market participants. The Fund may use options and futures on stock indices and Treasury bonds to adjust its relative investment exposures to the stock and bond markets, or to reduce the exposure of the Fund’s portfolio to the impact of general market fluctuations when market conditions are unfavorable in the view of the investment adviser.
The Hussman Strategic Total Return Fund has the ability to hedge the interest rate risk of its portfolio in an amount up to, but not exceeding, the value of its fixed income holdings. The Fund also has the ability to increase the interest rate exposure of its portfolio through limited purchases of Treasury zero-coupon securities and STRIPS. The Fund may also invest up to 30% of assets in alternatives to the U.S. fixed income market, including foreign government bonds, utility stocks, convertible bonds, real-estate investment trusts, and precious metals shares.
The Hussman Strategic International Fund invests primarily in equities of companies that derive a majority of their revenues or profits from, or have a majority of their assets in, a country or country other than the U.S., as well as shares of exchange traded funds (“ETFs”) and similar investment vehicles that invest primarily in the equity securities of such companies. The Fund has the ability to hedge market risk by selling short major market indices using swaps, index options and index futures in an amount up to, but not exceeding, the value of its stock holdings. These may include foreign stock indices, and indices of U.S. stocks such as the Standard and Poor’s 500 Index. Foreign markets can be more volatile than U.S. markets, and may involve additional risks.
The Prospectus of each Fund contains further information on investment objectives, strategies, risks and expenses. Please read the Prospectus carefully before investing.
The Market Climate is not a formula but a method of analysis. The term “Market Climate” and the graphics used to represent it are service marks of Hussman Strategic Advisors (formerly known as Hussman Econometrics Advisors). The Fund Manager has sole discretion in the measurement and interpretation of market conditions. Information relating to the investment strategy of each Fund is described in its Prospectus and Statement of Additional Information. A schedule of investment positions for each Fund is presented in the annual and semi-annual reports. Except for articles specifically citing investment positions held by the Funds, general market commentary does not necessarily reflect the investment position of the Funds.
Editor’s Note: The summary bullets for this article were chosen by Seeking Alpha editors.
Published at Sun, 16 Jan 2022 15:08:00 -0800
