Mid-Year Portfolio Review 2022 – Week in Review
Mid-Year Portfolio Review 2022
We are three weeks past the mid-point of the year, and the time for a mid-year portfolio review 2022 is upon us. Investors should not constantly review their retirement or after-tax portfolios. Those that do usually make too many changes and detract from returns. However, a buy and forget investment methodology is not an investment strategy. A mid-year portfolio review in 2022 is helpful to check asset allocations, rebalance as needed, plan for tax-loss harvesting, and identify holdings that no longer meet your goals.

Retirement Portfolio Review
Asset Allocation
For workers with 401(k) or Individual Retirement Account (IRA) plans, a 2022 mid-year portfolio review is an excellent time to review asset allocations. A bear market will impact asset allocations. Many workers prefer passive index funds or exchange-traded funds (ETFs) and often use a total market or S&P 500 Index fund as a core fund. A bear market will change retirement portfolio asset weightings, so equities are underweighted. Similarly, a bear market in bonds will lower bond weightings.
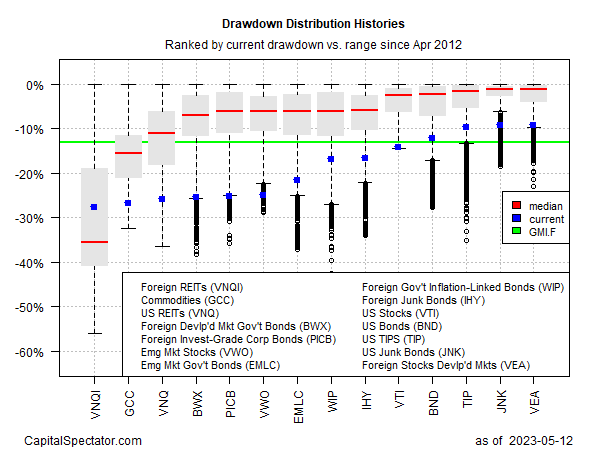
So far, 2022 has been unkind to equities and bonds, and a mid-year portfolio review is tricky. According to our watch list on Stock Rover*, both long-term bonds and stocks have performed poorly this year, making rebalancing harder. Furthermore, most workers rebalance annually instead of bi-annually.

Rebalancing
People desiring to rebalance should only do so thoughtfully. The main goal is to reduce risk. In general, equities are riskier than bonds. Too high an asset allocation of stocks means more volatility, especially for those nearing retirement. Bonds and cash serve to reduce the volatility of stocks.
The bottom line is to rebalance your target asset allocations when they deviate from a pre-determined value, like 5%, and not a random value. For example, suppose your US equity target allocation is 40%, and market action has taken that down to 35%, it may be time to rebalance. Rebalancing in a tax-advantaged plan does not trigger tax consequences, but it will in a taxable account.
Importantly, investors should stay the course for the long-term; bear markets eventually end. As John Bogle has said,
Time is your friend; impulse is your enemy.
Stocks Portfolio Review
No Longer Meet Goals
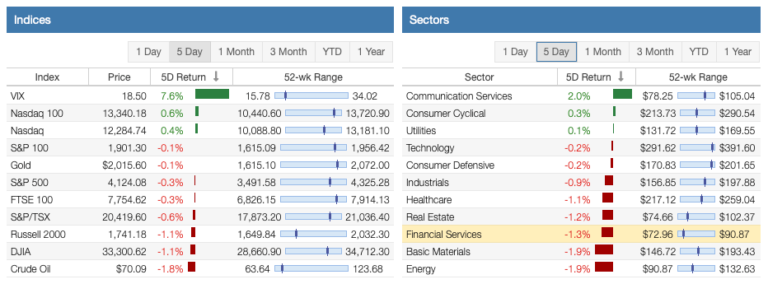
Next, investors should do a 2022 mid-year portfolio review of their stocks. This task is more complicated since the bear market has punished many favorite tech and growth stocks. On the other hand, the Energy, Utilities, Consumer Defensive, and Healthcare sectors have performed relatively well.
The goal is to review each holding and see if it still fits your investment thesis. Dividend growth investors and those seeking income have it easy. A dividend reduction or omission means selling the stock. You can also sell a dividend stock if the business fundamentals or dividend safety have materially changed.
Tax Loss Harvesting
A decline in stock price is probably not a sufficient reason to sell a stock. Bear markets and market corrections eventually end. However, if you are selling a stock for a loss, it may make sense to plan for tax loss harvesting at the end of the year. This process is when you sell stocks at a loss to offset stocks you sold for a gain. Just remember the IRS rules about selling stocks at a loss and buying the same investment within 30 days.
Final Thoughts on Mid-Year Portfolio Review 2022
Investors should certainly review their portfolio annually or bi-annually; anything more may be too much. Most investors perform rebalancing once per year in a tax-sheltered portfolio. However, stocks in the taxable account should be evaluated bi-annually to plan for the end-of-year tax-loss harvesting.
Affiliate
Dividend Power has partnered with Sure Dividend, one of the best newsletters for dividend stock investing. The newsletter comes out monthly and highlights their top 10 picks. A lot of effort goes into analyzing hundreds of stocks, doing much of the work for you. They have over 9,000 subscribers, and it grows every month.
Sign up for the Sure Dividend Newsletter*. You can also use the Sure Dividend coupon code DP41off. The regular price for Sure Dividend Newsletter* is $199 per year and the reduced price through this offer is $158 per year. There is a 7-day free trial and refund grace period as well. So, there is no risk.
If you are interested in higher-yielding stocks from the Sure Retirement Newsletter*, the same coupon code, DP41off, gives ~25% or $41 off. The regular price of the Sure Retirement Newsletter* is $199 and the reduced price through this offer is $158 per year.
If you are interested in buying and holding stocks with a rising income from the Sure Passive Income Newsletter*, the same coupon code, DP41off, gives ~25% or $41 off. The regular price of the Sure Passive Income Newsletter* is $199 and the reduced price through this offer is $158 per year.
The Stock of the Week
Today we highlight Whirlpool (WHR), the appliance giant. According to Stock Rover*, the stock price was down about 27% in 2022 and 20.3% in the past 1-year. Whirlpool’s stock price is down because of rising interest rates and anticipated lower home sales. Additionally, the company missed first-quarter revenue estimates and lowered guidance.
The stock currently has a dividend yield of roughly 4.2%, the highest since the pandemic and more than the 5-year average of about 3.14%. In addition, Whirlpool is a Dividend Contender and, according to Dividend Radar, has 12 years of dividend increases. Whirlpool is a market leader and consolidator in the industry. The forward P/E ratio is about 6.9X, below the 5-year and 10-year averages.

Dividend Increases and Reinstatements
Search for a stock in the list of dividend increases and reinstatements. This list is updated weekly. In addition, you can search for your stocks by company name, ticker, and date.
Dividend Cuts and Suspensions List
The dividend cuts and suspensions list was most recently updated at the end of June 2022. As a result, the number of companies on the list has risen to 560. Thus, well over 10% of companies that pay dividends have cut or suspended them since the start of the COVID-19 pandemic. The list is updated monthly.
Three new additions indicate companies are experiencing solid profits and cash flow in June.
The new additions were National CineMedia (NCMI), Sissecam Resources LP (SIRE), and Sculptor Capital Management (SCU).
Market Indices
07/23/22
Dow Jones Industrial Averages (DJIA): 31,900 (+1.96%)
NASDAQ: 11,834 (+3.33%)
S&P 500: 3,962 (+2.56%)
Market Valuation
The S&P 500 is trading at a price-to-earnings ratio of 20.02X, and the Schiller P/E Ratio is about 29.72X. These multiples are based on trailing twelve months (TTM) earnings.
Note that the long-term means of these two ratios are 15.97X and 16.95X, respectively.
The market is still overvalued despite the recent market correction and a bear market. Earnings multiples more than 30X are overvalued based on historical data.
S&P 500 PE Ratio History

Shiller PE Ratio History

Stock Market Volatility – CBOE VIX
This past week, the CBOE VIX measuring volatility was down about 1.5 points to 23.03. The long-term average is approximately 19 to 20. The CBOE VIX measures the stock market’s expectation of volatility based on S&P 500 Index options. It is commonly referred to as the fear index.

Yield Curve
The two yield curves shown here are the 10-year US Treasury Bond minus the 3-month US Treasury Bill from the NY York Fed and the 10-year US Treasury Bond minus the 2-year US Treasury Bond from the St. Louis Fed.
Inversion of the yield curve has been increasingly viewed as a leading indicator of recessions about two to six quarters ahead, according to the NY Fed. The higher the spread between the two interest rates, the higher the probability of a recession.


Economic News
The US Census Bureau reported housing starts dropped 2.0% to a seasonally adjusted annual rate of 1.559M units in June, the lowest level since September 2021. The data for May was revised up to 1.591M units from the previously reported 1.549M units. Building permits saw increases in the Northeast (+18.0%) and West (+5.8%), while the Midwest (-15.7%) and South (-2.1%) saw declines. Single-family housing completions came in at 996K, 4.1% below May’s reading. Multifamily completions were down 5.4% to 366K. The number of houses approved for construction but not yet started increased 1.1% to 285K units, with the backlog for single-family housing dropping 1.3% to 147K.
The National Association of Realtors reported that existing home sales fell 5.4% in June to a seasonally-adjusted annual rate of 5.12M, down 14.2% compared to June 2021, and a new low since June 2020. Home sales have now dropped for five consecutive months. Sales of single-family homes fell to a 4.57M annual rate (-12.8% Y/Y), and existing condo sales dropped to a 550K annual rate (-9.8% Y/Y). Total housing inventory was reported at 1.26M, up 9.6% over May’s inventory (+2.4% Y/Y). Unsold inventory is at a 3.0-month supply, up from 2.6 months in May and 2.5 months in June 2021. Properties typically remained on the market for 14 days, down from May’s 16 days reading. The median sales price of an existing home sold in June set another record at $416,000 (+13.4%Y/Y). The median existing single-family home price was $423,300 in June (+13.3% Y/Y), while the median existing condo price was $354,900 (+11.5% Y/Y). Regionally, existing-home sales in the Northeast were unchanged while the Midwest (-1.6%), West (-11.1%), and South (-6.2%) all saw declines.
The Labor Department reported an increase in initial jobless claims for the week ending July 16th. This increase marks the third week of increases and the highest level in 8-months. The seasonally adjusted initial claims were reported at 251,000, an increase of 7,000 from the previous week’s unrevised level. The four-week moving average, which smooths out volatility was 240,500.
Thanks for reading Mid-Year Portfolio Review 2022 – Week in Review!
Here are my recommendations:
If you are unsure how to invest in dividend stocks or are just getting started with dividend investing. Please look at my Review of the Simply Investing Report. I also provide a review of the Simply Investing Course. Note that I am an affiliate of Simply Investing.
If you are interested in an excellent resource for DIY dividend growth investors. I suggest reading my Review of The Sure Dividend Newsletter. Note that I am an affiliate of Sure Dividend.
If you want a leading investment research and portfolio management platform with all the fundamental metrics, screens, and analysis tools you need. Read my Review of Stock Rover. Note that I am an affiliate of Stock Rover.
If you would like notifications about when my new articles are published, please sign up for my free weekly e-mail. You will receive a free spreadsheet of the Dividend Kings! You will also join thousands of other readers each month!
*This post contains affiliate links meaning that I earn a commission for any purchases that you make at the Affiliates website through these links. This will not incur additional costs for you. Please read my disclosure for more information.
Published at Sun, 24 Jul 2022 04:00:00 -0700


