Stock Market This Week – 04/29/23
Stock Market This Week
Stock Market This Week – 04/29/23
The bad news about banks keeps on coming. According to news reports, First Residential (FRC), another Silicon Valley bank, experienced a massive outflow of deposits. However, unlike SVB, First Residential has avoided a government takeover, which may change soon. Regardless of the outcome, banks can probably expect more regulation in the future. The lesson here is that banks can fail quickly, unlike the slow-motion bankruptcies of other companies.
The news about FRC affected the stock market earlier in the week. But better than expected earnings, especially from Microsoft (MSFT) and Meta Platforms (META), caused tech stocks to surge. As a result, Microsoft’s share price is above $300, near a 52-week high, and closing in on an all-time high. Similarly, Meta’s stock price has almost doubled in 2023 and is at a 52-week high. In fact, all the mega-cap tech stocks are doing well.
Additionally, rates on U.S. Government-issued Series I Savings Bonds reset lower at 4.3%
Overall, the United States economy is performing well. The unemployment rate is low, jobs are still plentiful, and wages are reportedly increasing. However, Gross Domestic Product (GDP) growth is decreasing. Hence, forecasters are predicting a recession, but we are not there yet.
Stock Market Overview
The stock market had a positive week.
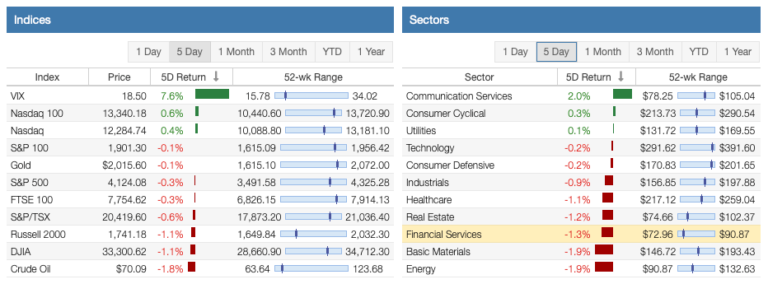
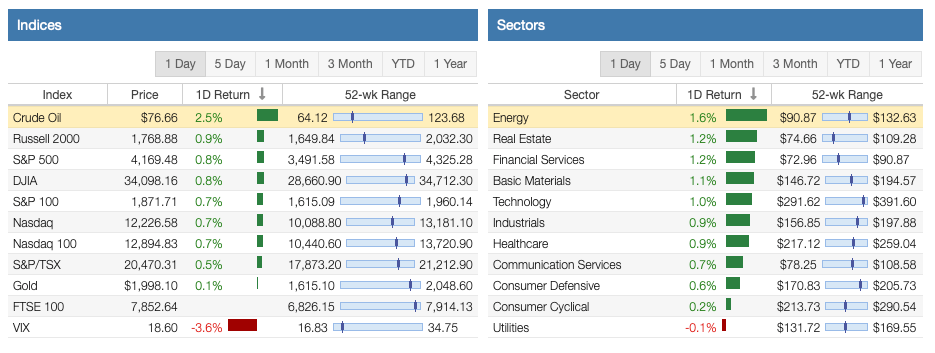
As shown by data from Stock Rover*, the Russell 2000, the S&P 500 Index, the Nasdaq, and the Dow Jones Industrial Average (DJIA) were up for the week.
Ten of the 11 sectors had positive returns for the week. Energy, Real Estate, and Financial Services were the top three sectors for the week. But the Consumer Defensive, Consumer Cyclical, and Utilities sectors performed worst.
Oil prices rose 2.5% but are still below $80 per barrel. The VIX fell and is still near its long-term average. Gold traded flat, now below $2,000 per ounce on a stronger U.S. dollar.

The Nasdaq is performing the best for the year, followed by the S&P 500 Index, the Dow 30, and the Russell 2000. In addition, 7 of the 11 sectors are up year-to-date. The three best-performing sectors are Communication Services, Technology, and Consumer Cyclical. Conversely, the worst-performing sectors are Utilities, Energy, and Financial Services.

Affiliate
Try the Sure Dividend Pro Plan. It includes the Sure Dividend Newsletter for dividend growth stocks. The Sure Dividend Retirement Newsletter for high-yield, REIT, and MLP stocks. The Sure Passive Newsletter for buy-and-hold forever stocks. Risk free 7-day free trial and grace period. Sure Dividend Coupon Code – DP100 for $100 off.
The dividend growth investing strategy has struggled with negative returns as banks and energy stocks declined, but is bouncing back. The table below shows their performance by category. Only the Dividend Aristocrats are in positive territory.

Dividend Increases and Reinstatements
Search for a stock in the list of dividend increases and reinstatements. This list is updated weekly. In addition, you can search for your stocks by company name, ticker, and date.
Dividend Cuts and Suspensions List
The dividend cuts and suspensions list was most recently updated at the end of April 2023. As a result, the number of companies on the list has risen to 638. The list is updated monthly.
Ten new additions indicate companies are starting to experience headwinds in April 2023.
Affiliate
Portfolio Insight has 9,000+ stocks and ETFs in its database. You can get access up to dozens of metrics, 20-years of financial data from S&P Global, and our Dividend Quality Grade.
The Portfolio Insight platform gives users access to portfolio management, charting, screening and ranking, investment news, SEC fillings, stock analyses, etc. Try it free for 14-days.
Stock Market Valuation This Week
The S&P 500 Index trades at a price-to-earnings ratio of 22.29X, and the Schiller P/E Ratio is about 29.73X. These multiples are based on trailing twelve months (TTM) earnings.
The long-term means of these two ratios are approximately 16X and 17X, respectively.
The market is still overvalued despite the recent correction and a bear market and rebound. Earnings multiples of more than 30X are overvalued based on historical data.
Economic News This Week
Provided by Stock Rover*.
Durable Goods Orders
New orders for manufactured durable goods increased (+3.2%) in March to $276.4B; this follows a (-1.2%) decrease in February and a (-5.0%) decrease in January. Total durable goods orders are up (+3.3%) year over year. Much of the increase in the headline number is attributable to a (+78.4%) jump in new orders for passenger planes; this follows (-8.4%) and (-56.3%) readings for the previous two months. Orders for nondefense aircraft and parts increased (+10.4%), computers and electronics (+1.9%), and appliances (+0.8%), while automobile makers reported a slight drop (-0.1%) in new orders.
Excluding the steep increase in orders for transportation equipment, “core” durable goods orders rose (+0.3%) and followed readings of (-0.3%) and (+0.4%) for the previous two months. New orders for capital goods increased (+8.7%) as nondefense orders increased (+10.4%). Excluding defense, new orders increased (+3.5%). Shipments of manufactured durable goods increased (+1.1%) to $277.0B and followed readings of (-0.8%) and (-0.4%) for the previous two months. Unfilled orders, up thirty of the last thirty-one months, increased (+0.4%) to $1,160B. Inventories decreased (-0.9%) to $488.8B and followed readings of (+0.1%) and (-0.2%) for the previous two months.
Gross Domestic Product
The Commerce Department’s first estimate on the first-quarter gross domestic product (GDP) growth reported the economy expanded at an annual rate of 1.1%. The first estimate is well under the 2.6% growth in the fourth quarter. Primary contributors to the slowdown in growth were a decline in private inventory investment and a deceleration in nonresidential fixed investment. The inventory slowdown took 2.26 percentage points off the headline number. In addition, business investment increased slightly (+0.7%) and followed a (+4.0%) reading in the prior quarter. As a result, business investment added only 0.10 percentage points to the headline number.
As measured by personal consumption expenditures, consumer spending was strong, increasing (+3.7%), up from (+1.0%), the previous quarter. Government consumption expenditures reported up (+4.7%) and added 0.81 percentage points to the headline number. The personal consumption expenditures price index, a closely watched measure of inflation by the Federal Reserve, increased (+4.2%), as compared to (+3.7%), (+4.3%), (+7.3%), and (+7.5%) over the previous four quarters. Core personal consumption expenditures, which strip out food and energy, increased by 4.9%, as compared to (+4.4%), (+4.7%), (+4.7), and (+5.6%) over the four previous quarters.
Personal Consumption Expenditures
The Personal Consumption Expenditures (PCE) price index increased by 4.2% from March 2022, as compared to readings of (+5.1%), (+5.4%), (+5.3%), and (+5.7%) over the previous months. This is the lowest level since May 2021. The PCE is watched closely by the Fed as it portends future inflation. On a monthly basis, the headline number showed a (+0.1%) increase, as compared to (+0.3%), (+0.6%), (+0.3%), and (+0.4%) over the previous months.
Consumer spending was little changed in March as an increase in spending on services was offset by a decrease in spending on goods. Lower food and energy costs helped slow the pace of inflation as food prices decreased (-0.2%) and energy prices decreased (-3.7%). As a result, the closely watched core PCE index, which strips out the more volatile factors of food and energy, continued to plateau with a year-over-year (+4.6%) increase; this follows readings of (+4.7%), (+4.7%), (+4.6%), and (+4.8%) over the previous months.
Resources
Curated Weekend Reading From Around The Web
Portfolio Management and Investing
Retirement
Financial Independence
Here are my recommendations:
Affiliates
- Simply Investing Report & Analysis Platform or the Course can teach you how to invest in stocks. Try it free for 14 days.
- Sure Dividend Pro Plan is an excellent resource for DIY dividend growth investors and retirees. Try it free for 7 days.
- Stock Rover is the leading investment research platform with all the fundamental metrics, screens, and analysis tools you need. Try it free for 14 days.
- Portfolio Insight is the newest and most complete portfolio management tool with built-in stock screeners. Try it free for 14 days.
Receive a free e-book, “5 Fundamental Metric to Check for a Dividend Growth Stock!” Join thousands of other readers !
*This post contains affiliate links meaning that I earn a commission for any purchases that you make at the Affiliates website through these links. This will not incur additional costs for you. Please read my disclosure for more information.
Prakash Kolli is the founder of the Dividend Power site. He is a self-taught investor, analyst, and writer on dividend growth stocks and financial independence. His writings can be found on Seeking Alpha, InvestorPlace, Business Insider, Nasdaq, TalkMarkets, ValueWalk, The Money Show, Forbes, Yahoo Finance, and leading financial sites. In addition, he is part of the Portfolio Insight and Sure Dividend teams. He was recently in the top 1.0% and 100 (73 out of over 13,450) financial bloggers, as tracked by TipRanks (an independent analyst tracking site) for his articles on Seeking Alpha.
Published at Sat, 29 Apr 2023 04:00:00 -0700
