Quantitative monetary easing is credited for juicing stock market returns and boosting other speculative asset values by flooding markets with liquidity as the Federal Reserve snapped up trillions of dollars in bonds during both the 2008 financial crisis and the 2020 coronavirus pandemic in particular. Investors and policy makers may be underestimating what happens as the tide goes out.
“I don’t know if the Fed or anybody else truly understands the impact of QT just yet,” said Aidan Garrib, head of global macro strategy and research at Montreal-based PGM Global, in a phone interview.
The Fed, in fact, began slowly shrinking its balance sheet — a process known as quantitative tightening, or QT — earlier this year. Now it’s accelerating the process, as planned, and it’s making some market watchers nervous.
A lack of historical experience around the process is raising the uncertainty level. Meanwhile, research that increasingly credits quantitative easing, or QE, with giving asset prices a lift logically points to the potential for QT to do the opposite.
Since 2010, QE has explained about 50% of the movement in market price-to-earnings multiples, said Savita Subramanian, equity and quant strategist at Bank of America, in an Aug. 15 research note (see chart below).
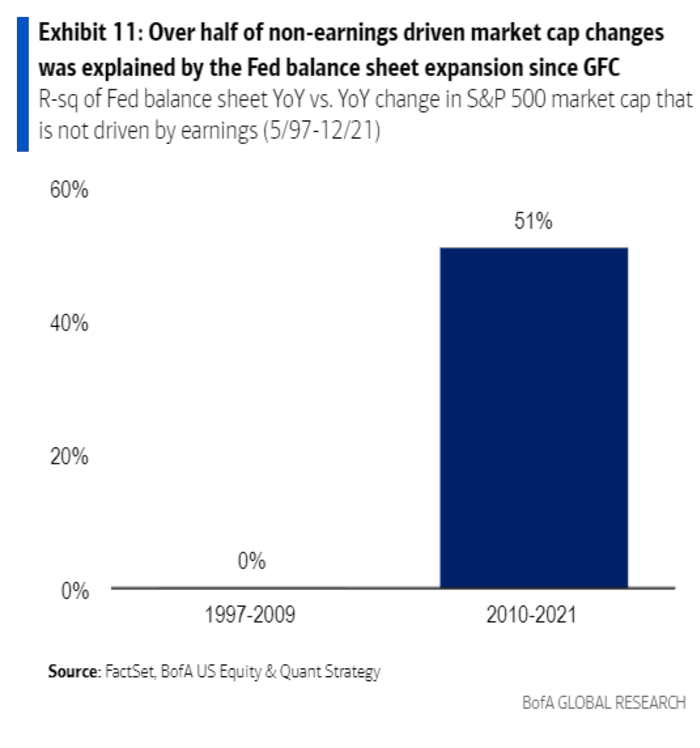
BofA U.S. Equity & Quant Strategy
“Based on the strong linear relationship between QE and S&P 500 returns from 2010 to 2019, QT through 2023 would translate into a 7 percentage-point drop in the S&P 500 from here,” she wrote.
Archive: How much of the stock market’s rise is due to QE? Here’s an estimate
In quantitative easing, a central bank creates credit that’s used to buy securities on the open market. Purchases of long-dated bonds are intended to drive down yields, which is seen enhancing appetite for risky assets as investors look elsewhere for higher returns. QE creates new reserves on bank balance sheets. The added cushion gives banks, which must hold reserves in line with regulations, more room to lend or to finance trading activity by hedge funds and other financial market participants, further enhancing market liquidity.
The way to think about the relationship between QE and equities is to note that as central banks undertake QE, it raises forward earnings expectations. That, in turn, lowers the equity risk premium, which is the extra return investors demand to hold risky equities over safe Treasurys, noted PGM Global’s Garrib. Investors are willing to venture further out on the risk curve, he said, which explains the surge in earnings-free “dream stocks” and other highly speculative assets amid the QE flood as the economy and stock market recovered from the pandemic in 2021.
However, with the economy recovering and inflation rising the Fed began shrinking its balance sheet in June, and is doubling the pace in September to its maximum rate of $95 billion per month. This will be accomplished by letting $60 billion of Treasurys and $35 billion of mortgage backed securities roll off the balance sheet without reinvestment. At that pace, the balance sheet could shrink by $1 trillion in a year.
The unwinding of the Fed’s balance sheet that began in 2017 after the economy had long recovered from the 2008-2009 crisis was supposed to be as exciting as “watching paint dry,” then-Federal Reserve Chairwoman Janet Yellen said at the time. It was a ho-hum affair until the fall of 2019, when the Fed had to inject cash into malfunctioning money markets. QE then resumed in 2020 in response to the COVID-19 pandemic.
More economists and analysts have been ringing alarm bells over the possibility of a repeat of the 2019 liquidity crunch.
“If the past repeats, the shrinking of the central bank’s balance sheet is not likely to be an entirely benign process and will require careful monitoring of the banking sector’s on-and off-balance sheet demandable liabilities,” warned Raghuram Rajan, former governor of the Reserve Bank of India and former chief economist at the International Monetary Fund, and other researchers in a paper presented at the Kansas City Fed’s annual symposium in Jackson Hole, Wyoming, last month.
Hedge-fund giant Bridgewater Associates in June warned that QT was contributing to a “liquidity hole” in the bond market.
The slow pace of the wind-down so far and the composition of the balance-sheet reduction have muted the effect of QT so far, but that’s set to change, Garrib said.
He noted that QT is usually described in the context of the asset side of the Fed’s balance sheet, but it’s the liability side that matters to financial markets. And so far, reductions in Fed liabilities have been concentrated in the Treasury General Account, or TGA, which effectively serves as the government’s checking account.
That’s actually served to improve market liquidity he explained, as it means the government has been spending money to pay for goods and services. It won’t last.
The Treasury plans to increase debt issuance in coming months, which will boost the size of the TGA. The Fed will actively redeem T-bills when coupon maturities aren’t sufficient to meet their monthly balance sheet reductions as part of QT, Garrib said.
The Treasury will be effectively taking money out of economy and putting it into the government’s checking account — a net drag — as it issues more debt. That will put more pressure on the private sector to absorb those Treasurys, which means less money to put into other assets, he said.
The worry for stock-market investors is that high inflation means the Fed won’t have the ability to pivot on a dime as it did during past periods of market stress, said Garrib, who argued that the tightening by the Fed and other major central banks could set up the stock market for a test of the June lows in a drop that could go “significantly below” those levels.
The main takeaway, he said, is “don’t fight the Fed on the way up and don’t fight the Fed on the way down.”
Stocks ended higher on Friday, with the Dow Jones Industrial Average
DJIA,
S&P 500
SPX,
and Nasdaq Composite
COMP,
snapping a three-week run of weekly losses.
The highlight of the week ahead will likely come on Tuesday, with the release of the August consumer-price index, which will be parsed for signs inflation is heading back down.
Published at Sat, 10 Sep 2022 05:15:00 -0700
