5 High-Yield Dividend Aristocrats To Thrive During This Bear Market
peshkov
On Friday, Fed Chair Jerome Powell gave what some consider the most hawkish speech of his career, which sent stocks crashing 4% in a matter of hours.
It was the market’s worst day in two months, and the Dow plunged 1008 points as the dragon of Constitution Avenue torched Wall Street’s dreams of a Fed pivot. What did Powell say that sent stocks crashing 4% and speculative tech stocks 7%?
- inflation is much too high (obvious)
- price stability is the cornerstone of sustainable economic growth and a healthy labor market (also obvious)
- history shows that once high inflation becomes entrenched in consumer and business expectations, a lot more pain is needed to bring it under control (the 70’s taught us this)
- more pain will be necessary to bring inflation back to the Fed’s 2% target
- including rising unemployment
- and tightening financial conditions (a weaker stock market)
Among blue-chip economists such as Morgan Stanley (MS), JPMorgan (JPM), and Bank of America (BAC), as well as current and former heads of the IMF and World Bank, Powell’s speech received glowing praise for being blunt, honest, and showing the Fed’s resolute determination to slay the inflation dragon before it can lay waste to our economy.
- the mirror image of his 2021 “inflation is transitory” speech
Nothing Powell said was surprising or a change in policy in the last few weeks. In fact, for two months, every Fed president has come out to say in no uncertain terms that:
- the Fed is far from done
- the Fed won’t stop hiking until it believes inflation is coming under control
- the Fed won’t cut rates or stop QT until inflation has been beaten (potentially waiting 18 to 24 months before cutting)
CME Group
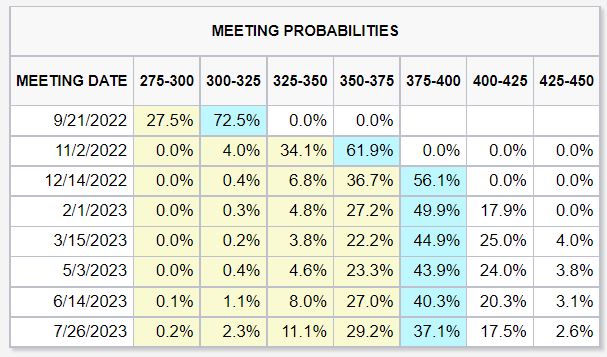
The bond market has gotten the message and now expects a 75 basis point hike in September, a 50 point hike in November, and a final 25 basis point hike in December.
More importantly, gone are expectations for rate cuts in the first half of 2023.
Does this mean that a recession is now a certainty? That the stock market is doomed to a 25% to 30% further decline as Goldman Sachs, Morgan Stanley, and Bridgewater expect?
The risk of recession has increased, that’s for sure. Through the yield curves, the bond market is now estimating an 87% recession probability within 13 months.
What about the market retesting the June lows or falling a lot more? Fundamentals would indicate this is likely, though it’s far from certain. It’s possible the market just trades within a choppy range of -15% to -20% for several months or even a year.
But if the market does end up bottoming at -35% to -40% for the S&P 500, up to a 30% further plunge for stocks, you need to be aware of a few important facts that can protect your hard-earned savings from dangerous and costly mistakes.
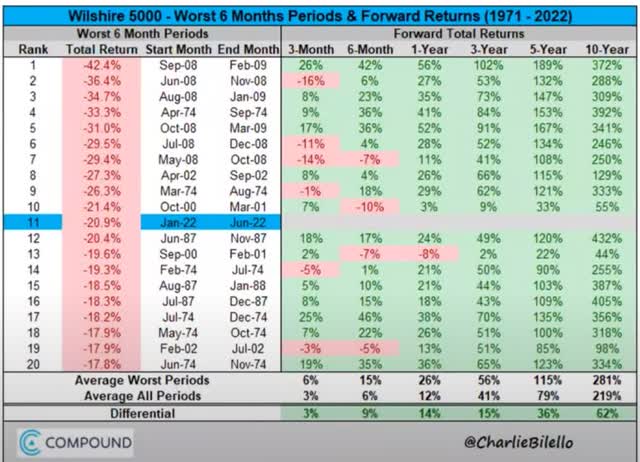
Fact One: This Too Shall Pass
Charlie Bilello
Even if we get a recession in 2023, which the bond market and most CEOs now expect, it’s not likely to stop investors from earning incredible returns in the coming decade.
Fact Two: The Next Record High Might Not Come Until 2025
The next year or even two might be no fun for anyone. Bulls might be disappointed at the lack of a V-shaped recovery due to high-interest rates and the Fed draining $95 billion per month in liquidity.
Bears might be disappointed by a lack of frantic selling pressure and the kind of extreme crashes that doomsday prophets like John Hussman, Michael Burry, and Robert Kiyosaki have been predicting for over a decade (60% to 90% crashes).
What happens if stocks end up bottoming at -40%? The 10-year forward historical return on stocks rises to about 6.5X.
What if stocks just trade flat for a year or two? Then buy and hold S&P investors are likely to earn “just” 4X returns by 2032.
Historically speaking, we shouldn’t expect a new record high until February 2025, which would coincide with the Fed’s plans for higher for longer rates.
Do you know the only real losers to the Fed’s planned higher for longer interest rate regime? Market timers.
Fact 3: Time In The Market, Not Timing The Market
JPMorgan Asset Management
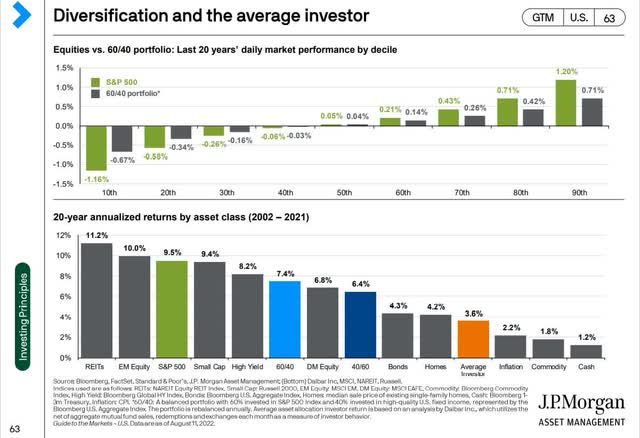
98% of market timers lose money in the long-term. 1% make enough money to earn a living doing it (and they almost all work at Wall Street’s most prestigious banks and hedge funds).
The rest of us shouldn’t even consider market timing because it’s almost impossible to do consistently well. And it’s why the average investor underperformed the S&P by 2/3 in the last 20 years. Heck, it’s why the average investor underperformed a super conservative 40% stock/60% bond portfolio and lost to every asset other than commodities and cash.
But what if you just can’t help rubbernecking the bull market, like the passerby of a train wreck? What if you just can’t help checking your portfolio every day as many of us on Seeking Alpha do?
How can we stay safe, sane, and rational for a year or even two, in which the Fed keeps rates high and money tight and in which market volatility is likely to remain elevated?
This is where the power of high-yield, ultra-low volatility dividend aristocrats comes in.
How To Find The Best High-Yield Ultra-Low Volatility Dividend Aristocrats In This Scary Market… In 2 Minutes
Why are ultra-low volatility high-yield aristocrats a potentially wonderful solution to a bear market?
- you get paid to wait out the bear market
- your income rises every year, no matter if we get a recession or not
- ultra low volatility aristocrats can deliver smaller declines than even a 60/40 retirement portfolio in bear markets and severe market crashes
In other words, ultra-low volatility, high-yield aristocrats take sleeping well at night to a whole new level.
For every article I write, I use the Dividend Kings Zen Research Terminal, which runs off the DK 500 Master List.
The DK 500 Master List is one of the world’s best watchlists, including
- every dividend aristocrat (S&P companies with 25+ year dividend growth streaks)
- every dividend champion (every company, including foreign, with 25+ year dividend growth streaks)
- every dividend king (every company with 50+ year dividend growth streaks)
- every foreign aristocrat (every company with 20+ year dividend growth streaks)
- every Ultra SWAN (wide moat aristocrats, as close to perfect quality companies as exist)
- 40 of the world’s best growth stocks
Let me show you how to quickly and easily find the best high-yield, ultra-low volatility aristocrats in just two minutes.
- Screen for dividend champions (which include foreign and small and medium-cap aristocrats): 135 companies remain
- screen for reasonable buys, good buys, strong buys, very strong buys, and ultra value buys: 77 companies remain
- screen for 3+% yielding companies: 32 companies remain
- screen for 8+% long-term consensus total return potential (my rule of thumb for defensive stocks): 28 companies remain
- add volatility column and sort by lowest to highest volatility
- select all the companies with 20% or less average annual volatility: 5 companies remain
- use the watchlist builder tab to select those five companies
- total time: 2 minutes
For context, here is the average annual volatility for:
- average standard alone companies: 28%
- average dividend aristocrat: 24%
5 High-Yield Dividend Aristocrats To Thrive Through This Bear Market
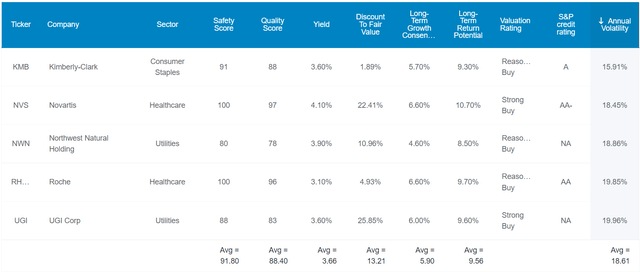
(Source: Dividend Kings Zen Research Terminal)
I’ve linked to articles exploring each company’s investment thesis, growth outlook, risk profile, and valuation and total return profiles.
In order of lowest to highest average annual volatility (over the last 15 years):
Tax Implications
NVS and RHHBY are Swiss companies that have dividend tax withholdings.
- 15% based on tax treaties with the US
- BUT the standard 35% withholding will be applied unless your broker files the appropriate paperwork
- you must own them in taxable accounts to qualify for the tax credit to recoup the withholding and earn the headline yield
FAST Graphs Up Front
Kimberly-Clark 2024 Consensus Total Return Potential
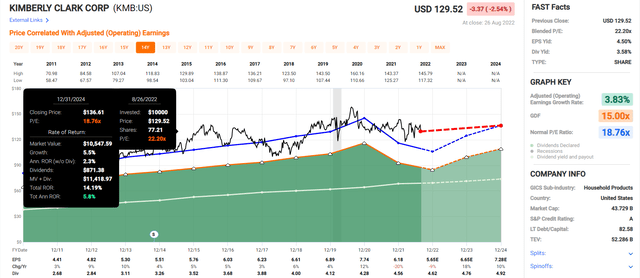
(Source: FAST Graphs, FactSet Research)
Note that KMB’s fair value is higher than it looks due to historical dividend yield-based fair value.
- which isn’t affected by temporary weakness in fundamentals
Novartis 2024 Consensus Total Return Potential
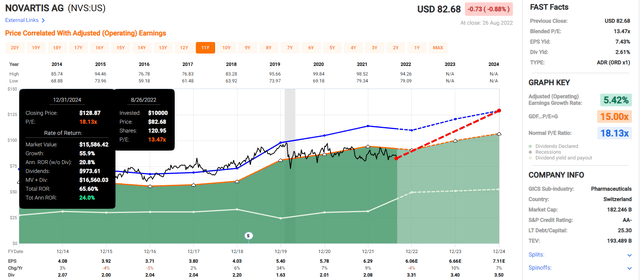
(Source: FAST Graphs, FactSet Research)
Northwest Natural Holding 2024 Consensus Total Return Potential
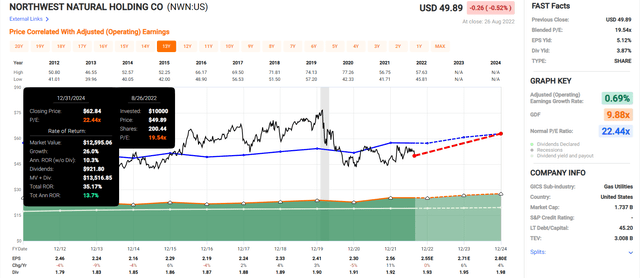
(Source: FAST Graphs, FactSet Research)
Roche 2024 Consensus Total Return Potential
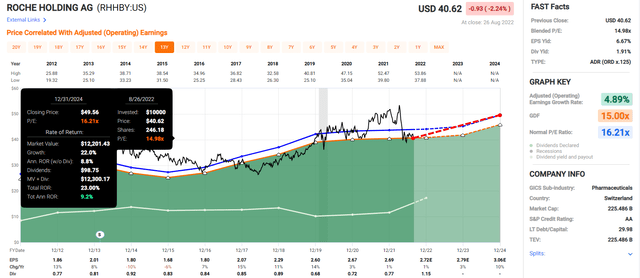
(Source: FAST Graphs, FactSet Research)
UGI Corp 2024 Consensus Total Return Potential
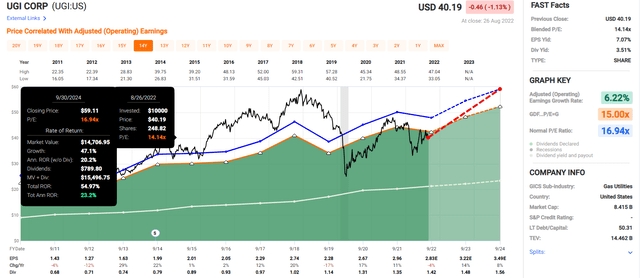
(Source: FAST Graphs, FactSet Research)
Now compare these ultra-low volatility aristocrats to the S&P 500.
S&P 500 2024 Consensus Total Return Potential
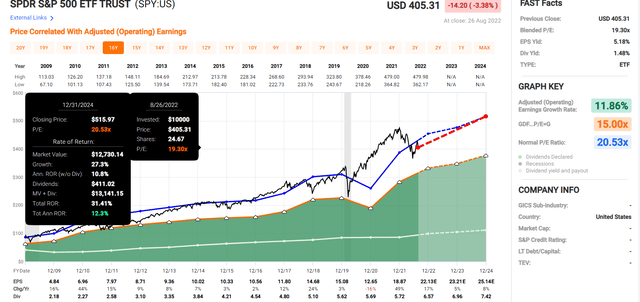
(Source: FAST Graphs, FactSet Research)
Analysts expect the S&P 500 to deliver 12% CAGR returns over the next 2.5 years.
They expect a 15% CAGR annual return from these aristocrats, which:
- yield more than 2X as much
- historically have 20% lower volatility
- historically fall 50% less than the market during severe market crashes
In other words, you can have your high-yield ultra-low volatility cake and eat it too.
High-Yield Aristocrats You Can Trust In All Economic Conditions
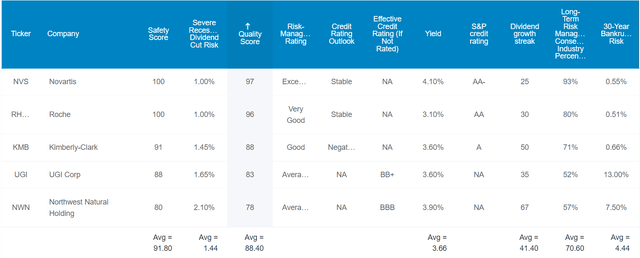
(Source: Dividend Kings Zen Research Terminal)
These are Super SWAN (sleep well at night) quality aristocrats that represent some of the most dependable high-yield on earth. How do we know? By comparing them to the dividend aristocrats, the bluest of blue-chips.
Higher Quality Than The Dividend Aristocrats
| Metric | Dividend Aristocrats | 5 High-Yield Ultra-Low Volatility Dividend Aristocrats | Winner Dividend Aristocrats |
Winner 5 High-Yield Ultra-Low Volatility Dividend Aristocrats |
| Quality | 87% | 88% | 1 | |
| Safety | 90% | 92% | 1 | |
| Average Recession Dividend Cut Risk | 0.5% | 0.5% | 1 | 1 |
| Severe Recession Dividend Cut Risk | 1.5% | 1.4% | 1 | |
| Dependability | 84% | 85% | 1 | |
| Dividend Growth Streak (Years) | 44.8 | 41.4 | 1 | |
| Long-Term Risk Management Industry Percentile | 67% Above-Average, Low-Risk |
71% Good, Low-Risk |
1 | |
| Average Credit Rating | A- Stable | BBB+ Stable | 1 | |
| Average Bankruptcy Risk | 3.04% | 4.44% | 1 | |
| Average Return On Capital | 105% | 203% | 1 | |
| Average ROC Industry Percentile | 83% | 90% | 1 | |
| 13-Year Median ROC | 89% | 58% | 1 | |
| Forward PE | 20.0 | 16.8 | 1 | |
| Discount To Fair Value | 1% | 13% | 1 | |
| DK Rating | Reasonable Buy | Good Buy | 1 | |
| Yield | 2.5% | 3.7% | 1 | |
| LT Growth Consensus | 8.7% | 5.9% | 1 | |
| Total Return Potential | 11.2% | 9.6% | 1 | |
| Risk-Adjusted Expected Return | 7.6% | 6.4% | 1 | |
| Inflation & Risk-Adjusted Expected Return | 5.4% | 4.2% | 1 | |
| Conservative Years To Double | 13.4 | 17.3 | 1 | |
| Total | 10 | 12 |
(Source: Dividend Kings Zen Research Terminal)
The average aristocrat has a 0.5% risk of a dividend cut in a historically average recession (like what’s likely coming in 2023).
The same is true of these ultra-low volatility high-yield aristocrats.
The average aristocrat’s risk of a cut in a severe recession, like the Pandemic or Great Recession, is about 1.5% for these aristocrats, its 1.4%.
Ben Graham considered a 20+ year dividend growth streak an important sign of excellent quality. The aristocrats certainly pass that standard with a 45-year dividend growth streak.
But these high-yield aristocrats have a 41-year streak, also more than 2X the Graham standard of excellence.
Joel Greenblatt is one of the greatest investors in history with 40% CAGR total returns for 21 years. He considers return on capital to be his gold standard proxy for quality and moatiness.
- return on capital: annual pre-tax income/the cost of running the business for a year
The S&P 500’s 2021 ROC was 14.6%, and in the last year, the aristocrats had 105% ROC.
- 7X higher than the S&P 500
These ultra-low volatility aristocrats had 203% ROC, almost 2X that of the aristocrats and 15X higher than the S&P 500.
- According to one of the greatest investors in history, these aristocrats are 15X higher quality than the average S&P 500 company
The aristocrat’s average ROC in the 83rd percentile of their industries, wide moats blue-chips. These high-yield aristocrats have ROC in the 90th industry percentiles.
And over the last 13 years, their ROC has risen from 58% to 203%, almost quadrupling.
- their wide moats have gotten wider and stronger
- their quality has improved
S&P estimates the 30-year bankruptcy risk (fundamental risk) for the average aristocrat at 3%, an A- stable rated company.
These aristocrats’ average credit rating is BBB+ stable, with a 4.4% fundamental risk.
Six rating agencies consider the average aristocrat to have 67th percentile long-term risk management.
- factoring in all risks, from climate change to labor relations to supply chain management and sustaining their moats over time
These aristocrats? 71st industry percentile risk management.
These High-Yield Aristocrat’s Long-Term Risk Management Is The 157th Best In The Master List (69th Percentile)
| Classification | Average Consensus LT Risk-Management Industry Percentile |
Risk-Management Rating |
| S&P Global (SPGI) #1 Risk Management In The Master List | 94 | Exceptional |
| Strong ESG Stocks | 78 |
Good – Bordering On Very Good |
| Foreign Dividend Stocks | 75 | Good |
| 5 High-Yield, Ultra-Low Volatility Aristocrats | 71 | Good |
| Ultra SWANs | 71 | Good |
| Low Volatility Stocks | 68 | Above-Average |
| Dividend Aristocrats | 67 | Above-Average |
| Dividend Kings | 63 | Above-Average |
| Master List average | 62 | Above-Average |
| Hyper-Growth stocks | 61 | Above-Average |
| Monthly Dividend Stocks | 60 | Above-Average |
| Dividend Champions | 57 | Average bordering on above-average |
(Source: DK Research Terminal)
That’s on par with the Ultra SWANs, as close to perfect quality dividend blue-chips as exist on Wall Street. It’s better than the aristocrats and in the top 31% of the world’s highest quality companies and similar to that of such other blue-chips as
- 3M (MMM): Ultra SWAN dividend king
- British American Tobacco (BTI): Ultra SWAN global aristocrat
- Johnson & Johnson (JNJ): Ultra SWAN dividend king
- Federal Realty Investment Trust (FRT): Ultra SWAN dividend king
- Enbridge (ENB): Ultra SWAN global aristocrat
The bottom line is that all companies have risks, and these high-yield aristocrats are good, at managing theirs.
How We Monitor These 5 Aristocrats’ Risk Profile
- 79 analysts
- 3 credit rating agencies
- 8 total risk rating agencies
- 77 experts who collectively know this business better than anyone other than management
- and the bond market for real-time fundamental risk assessment when news breaks
“When the facts change, I change my mind. What do you do, sir?” – John Maynard Keynes
There are no sacred cows at iREIT or Dividend Kings. Wherever the fundamentals lead, we always follow. That’s the essence of disciplined financial science, the math behind retiring rich and staying rich in retirement
OK, now that you understand why you can trust these high-yield, ultra-low volatility Super SWAN aristocrats with your money, here’s why you might want to buy them today.
Wonderful Companies At Attractive Valuations
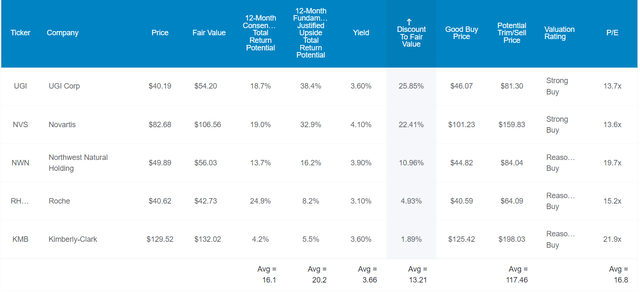
(Source: Dividend Kings Zen Research Terminal)
For context, the S&P 500 is trading at 17.3X forward earnings and is still 3% historically overvalued.
The dividend aristocrats are trading at 20.0X forward earnings and are 1% historically undervalued.
- a potentially reasonable buy
These high-yield aristocrats are trading at 16.8X forward earnings and are 13% historically undervalued.
- a potentially good buy
Analysts expect these aristocrats will deliver 16% total returns in the next year, but their 12-month fundamentally justified total returns are 20%.
- if they all grow as expected and return to historical mid-range market-determined fair value you will earn 20%
But my goal isn’t to help you earn a 16% or 20% total return from some of the world’s highest quality and safest ultra-low volatility high-yield aristocrats.
My goal is to help you earn potentially life-changing 8X to 75X inflation-adjusted returns over an investing life-time.
Long-Term Fundamentals That Can Help You Retire In Safety And Splendor
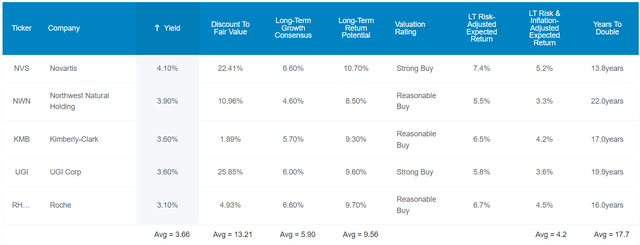
(Source: Dividend Kings Zen Research Terminal)
These ultra-low volatility aristocrats offer one of the world’s safest 3.7% yields and are growing at about 6%, with analysts expecting 9.6% long-term returns over time.
Is that as good as the aristocrats and S&P 500? No. But then again, that’s not the goal of this portfolio bucket.
- the goal is generous and very safe yield that grows every year no matter what
- and returns of over 8% annually
How can 9.6% long-term returns possibly be life-changing? How can it help you retire in safety and splendor?
Inflation-Adjusted Consensus Return Potential: $1,000 Initial Investment
| Time Frame (Years) | 7.9% CAGR Inflation And Risk-Adjusted S&P Consensus | 8.9% Inflation-Adjusted Aristocrat Consensus | 7.4% CAGR Inflation-Adjusted 5 High-Yield Ultra-Low Volatility Aristocrats Consensus |
| 5 | $1,461.18 | $1,530.17 | $1,427.63 |
| 10 | $2,135.06 | $2,341.43 | $2,038.14 |
| 15 | $3,119.71 | $3,582.79 | $2,909.72 |
| 20 | $4,558.47 | $5,482.29 | $4,154.01 |
| 25 | $6,660.75 | $8,388.86 | $5,930.41 |
| 30 (Retirement time frame) | $9,732.58 | $12,836.40 | $8,466.46 |
| 35 | $14,221.09 | $19,641.92 | $12,087.01 |
| 40 | $20,779.62 | $30,055.54 | $17,255.84 |
| 45 | $30,362.83 | $45,990.17 | $24,635.02 |
| 50 | $44,365.65 | $70,372.93 | $35,169.81 |
| 55 | $64,826.35 | $107,682.76 | $50,209.63 |
| 60 (Investing lifetime) | $94,723.18 | $164,773.26 | $71,680.99 |
| 100(endowment time frame) | $1,968,311.27 | $4,952,348.74 | $1,236,915.30 |
(Source: DK Research Terminal, FactSet Research)
Over a long enough period of time, even a modest 9.6% total return can compound into a 72X inflation-adjusted return over your investing lifetime.
And if you pass your blue-chips onto your heirs, it can become a 1,237X inflation-adjusted return after 100 years.
What proof is there that these slow-growing, ultra-low, high-yield Super SWAN aristocrats can deliver ultra-low volatility, much less almost double-digit long-term returns over time?
Historical Returns Since September 2003 (Equal Weighting, Annual Rebalancing)
The future doesn’t repeat, but it often rhymes. – Mark Twain Past performance is no guarantee of future results.
Still, studies show that over time, blue-chips with relatively stable fundamentals offer predictable returns based on yield, growth, and valuation mean reversion.
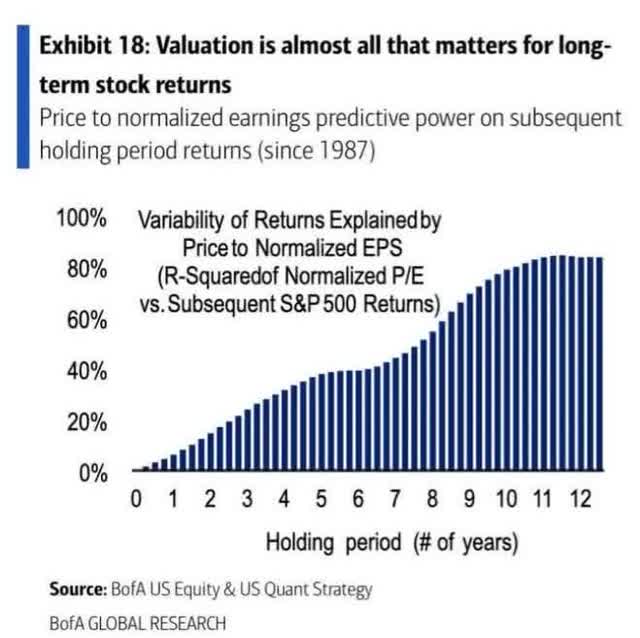
Bank of America
So let’s look at how these high-yield ultra-low volatility aristocrats have done over the last 26 years when approximately 90% of returns were the result of fundamentals, not luck.

(Source: Portfolio Visualizer Premium)
How realistic are 9.6% annual returns from these aristocrats? Since 2003 they’ve delivered 9.8% annual returns and sub-12 % annual volatility.
- 20% less volatility than the S&P 500
- but with 100X fewer companies
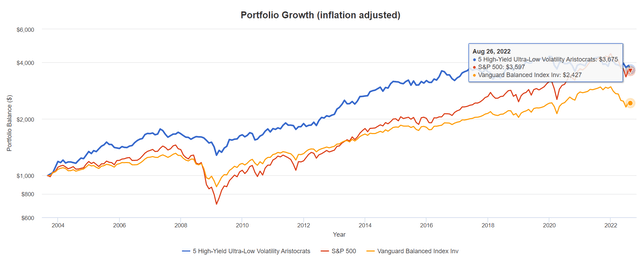
(Source: Portfolio Visualizer Premium)
How realistic are 7.4% inflation-adjusted returns from these aristocrats? In the past 19 years, they delivered 7.1% annual real returns and almost quadrupled investors’ money in inflation-adjusted terms.

(Source: Portfolio Visualizer Premium)
Look at how dependable these average rolling returns are. Matching the market over time but with a lot less volatility.
Sleeping Well At Night In All Market Conditions

(Source: Portfolio Visualizer Premium)
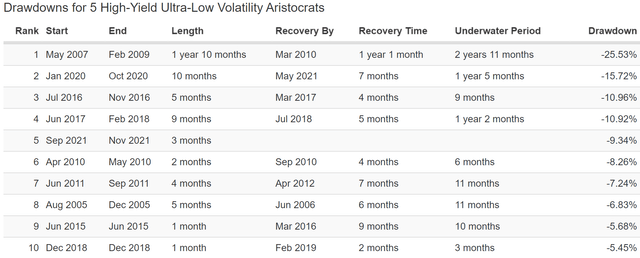
In the Great Recession, they fell a peak of 24%, less than half that of the market and less than a 60/40 portfolio. But with no bonds or hedging of any kind.
(Source: Portfolio Visualizer Premium)
How many bear markets have these aristocrats experienced in almost 20 years? One, only the Great Recession. In the 2022 bear market, they have only fallen 9.3%, not even a correction.
In contrast, here’s how many bear markets the S&P 500 has had over the last 19 years:
- 2007-2009
- 2011
- 2018
- 2020
- 2022
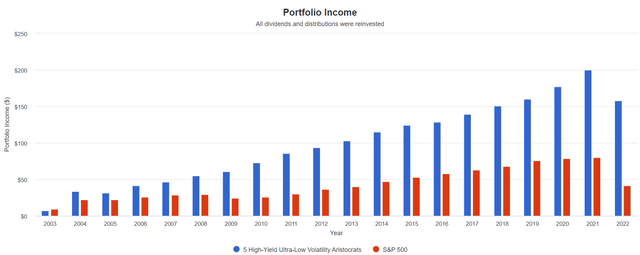
And let’s not forget about the main reason for owning dividend aristocrats, stable and dependable long-term dividend income.
A Dividend Growth Blue-Chip You Can Trust

(Source: Portfolio Visualizer Premium) – includes reinvested dividends in USD
Here is the value of generous, safe, and annually growing income that compounds for decades.
Cumulative Dividend Since 2004: $1,000 Initial Investment
| Metric | S&P 500 |
5 High-Yield Ultra-Low Volatility Aristocrats |
| Total Dividends | $891 | $2,136 |
| Annualized Income Growth Rate | 7.7% | 13.2% |
| Total Income/Initial Investment | 0.89 | 2.14 |
| Inflation-Adjusted Income/Initial Investment | 0.51 | 1.21 |
| More Inflation-Adjusted Income Than S&P 500 | NA | 2.40 |
| Starting Yield | 2.2% | 3.4% |
| Yield On Cost | 8.4% | 31.6% |
(Source: Portfolio Visualizer Premium)
Slow-growing high-yield aristocrats delivered 13% annual income growth, 2X more than the S&P 500.
A 32% yield on cost today and 2.4X the inflation-adjusted cumulative income of the S&P 500.
Consensus Future Income Growth Potential
| Analyst Consensus Income Growth Forecast | Risk-Adjusted Expected Income Growth | Risk And Tax-Adjusted Expected Income Growth |
Risk, Inflation, And Tax-Adjusted Income Growth Consensus |
| 12.9% | 9.0% | 7.7% | 5.5% |
(Source: DK Research Terminal, FactSet)
Analysts think these high-yield ultra-low volatility aristocrats could deliver 13% annual income growth in the future, which, adjusted for the risk of the company not growing as expected, inflation, and taxes, is 5.5% real expected income growth.
Now compare that to what they expect from the S&P 500.
| Time Frame | S&P Inflation-Adjusted Dividend Growth | S&P Inflation-Adjusted Earnings Growth |
| 1871-2021 | 1.6% | 2.1% |
| 1945-2021 | 2.4% | 3.5% |
| 1981-2021 (Modern Falling Rate Era) | 2.8% | 3.8% |
| 2008-2021 (Modern Low Rate Era) | 3.5% | 6.2% |
| FactSet Future Consensus | 2.0% | 5.2% |
(Sources: S&P, FactSet, Multipl.com)
- 1.7% post-tax inflation-adjusted income growth from the S&P 500
- S&P 500’s historical post-tax inflation-adjusted income growth rate (current tax code) is 5.8% CAGR
The S&P 500 is now dominated by buyback-friendly companies prioritizing repurchases over fast dividend growth.
What about a 60/40 retirement portfolio?
- 0.5% consensus inflation, risk, and tax-adjusted income growth.
This means not only do you get a very safe 3.7% yield today but potentially 3.2X faster income growth in the future compared to the S&P 500 and 11X faster than a 60/40.
This is the power of ultra-low volatility high-yield aristocrat investing in this bear market.
Bottom Line: These Are 5 High-Yield Ultra-Low-Volatility Aristocrats To Help You Thrive Through This Bear Market
The Fed put is dead, at least for now. Powell made it very clear at Jackson Hole that the Fed’s only mission is to crush inflation, economy and stock market be darned.
That doesn’t necessarily mean stocks are going to crash another 30% from here, but that is a very real risk that investors have to be prepared for in the coming year.
The good news is that high-yield, ultra-low-volatility aristocrats like KMB, NVS, NWN, RHHBY, and UGI can help you sleep well at night through these difficult and sometimes terrifying times.
- 3.7% very safe yield (safer than the dividend aristocrats)
- average credit rating BBB+ (4.4% fundamental risk)
- 71st industry percentile long-term risk management
- 5.9% long-term growth
- 9.6% long-term return potential Vs. 9.8% since 2003
- 11.7% annual volatility since 2003
- half the decline of the S&P during the Great Recession
- half the decline of the S&P during the 2022 bear market
- a 35% smaller decline than the S&P 500 during the Pandemic
- a smaller decline during the Great Recession than a 60/40 portfolio
This is how you practice defensive high-yield investing when the Fed put is dead.
This is how you not just survive but thrive though this, and all future bear markets.
This is how you practice prudent investing and smart investing in uncertain times.
This is how you take charge of your financial destiny and make your own luck on Wall Street.
And most importantly, this is how you can build the ultimate retirement portfolio for your needs and retire in safety and splendor. No matter what the Fed, inflation, the economy, or the stock market do in the coming years and decades.
Published at Tue, 30 Aug 2022 04:00:00 -0700
